Being able to visualize and depict scientific results is important as it not only facilitates effective communication of research, but it also allows for the detection of patterns and emerging characteristics within the data itself. Researchers from Dr. Inanç Birol’s Lab at the GSC developed RNA-Scoop, an interactive tool for visualizing differential transcript expression from single-cell transcriptome datasets.
According to the central dogma of biology, genes (composed of DNA) are transcribed to produce RNA, which is then translated to form a protein, referred to as the functional gene product. While scientists recognize that this central dogma is an oversimplification of the truth, the basis of the message is easy to relay and understand.
Transcript isoforms
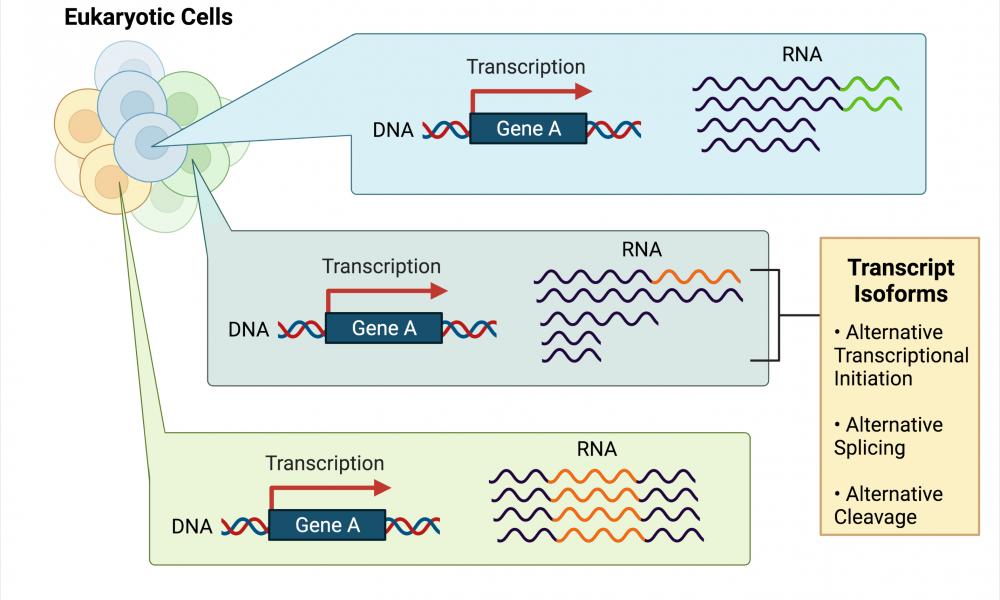
Interestingly, the number of genes within a single eukaryotic cell do not always correspond exactly to the number of unique proteins present within the same cell. Reasons for this lack of one-to-one correspondence include the fact that one gene may be able to produce more than one unique transcript. For example, some genes can be transcribed beginning at different locations to produce slightly different-sized RNA products (alternative transcriptional initiation), the RNA transcript itself may undergo processing steps that remove and rearrange some of the internal RNA (alternative splicing), and RNA can be cleaved at different locations within its poly-A tail, a large chain of adenine bases attached to the 3’ end of a transcript (alternative cleavage). When the same gene produces multiple RNA transcripts, these transcripts are referred to as “isoforms” of each other.
Some transcript isoforms can give rise to slightly variable proteins, providing one explanation as to why one gene may not always result in one unique protein. In many cases, transcript isoforms may not end up being translated at all; instead, transcripts may remain as functional RNA species (an exception to the central dogma).
Within a single cell, multiple RNA transcripts and transcript isoforms can be found at any given moment, all depending on whether the encoding gene is being actively transcribed. In some cases, transcript isoforms may serve a specific biological purpose and may only be expressed during specific stages of development or in specific cell/tissue types (e.g., isoform A may only be present in liver cells while isoform B may only be present in early embryonic cells). These specific instances where isoforms may or may not be present is referred to as differential isoform expression.
Single-cell sequencing
Recently, technological advancements in sequencing resolution have made it possible to identify and differentiate the nucleic acid content between single cells. Using single-cell RNA sequencing (scRNA-seq) technology, scientists are now able to detect and differentiate all of the transcript isoforms at single-cell resolution.
Multiple bioinformatics tools and programs have been developed to visualize scRNA-seq data; however, many of these tools have been limited in their ability to analyze transcript-level data as a whole. For example, there is currently no simple way to identify specific patterns (e.g., transcript isoform co-expression, transcript isoform switching, and cell category/cell cluster-specific expression) in transcript usage across the thousands of genes that produce transcripts. Also, while there are techniques to visualize and identify clusters of cells with similar expression profiles, there is no way to visualize or identify information about differentially expressed genes/transcripts between cell clusters.
Visualizing transcripts using RNA-Scoop
Published recently in NAR Genomics and Bioinformatics, researchers from the Birol Lab developed RNA-Scoop, an interactive tool that visualizes transcript usage across single-cell transcriptomes (see examples here). RNA-Scoop allows users to easily identify and visualize differentially expressed transcripts across cell groups, see transcripts with specific expression patterns, and observe transcript structure (e.g., alternative transcriptional initiation, alternative splicing, and alternative cleavage and how they vary across different groups of cells).

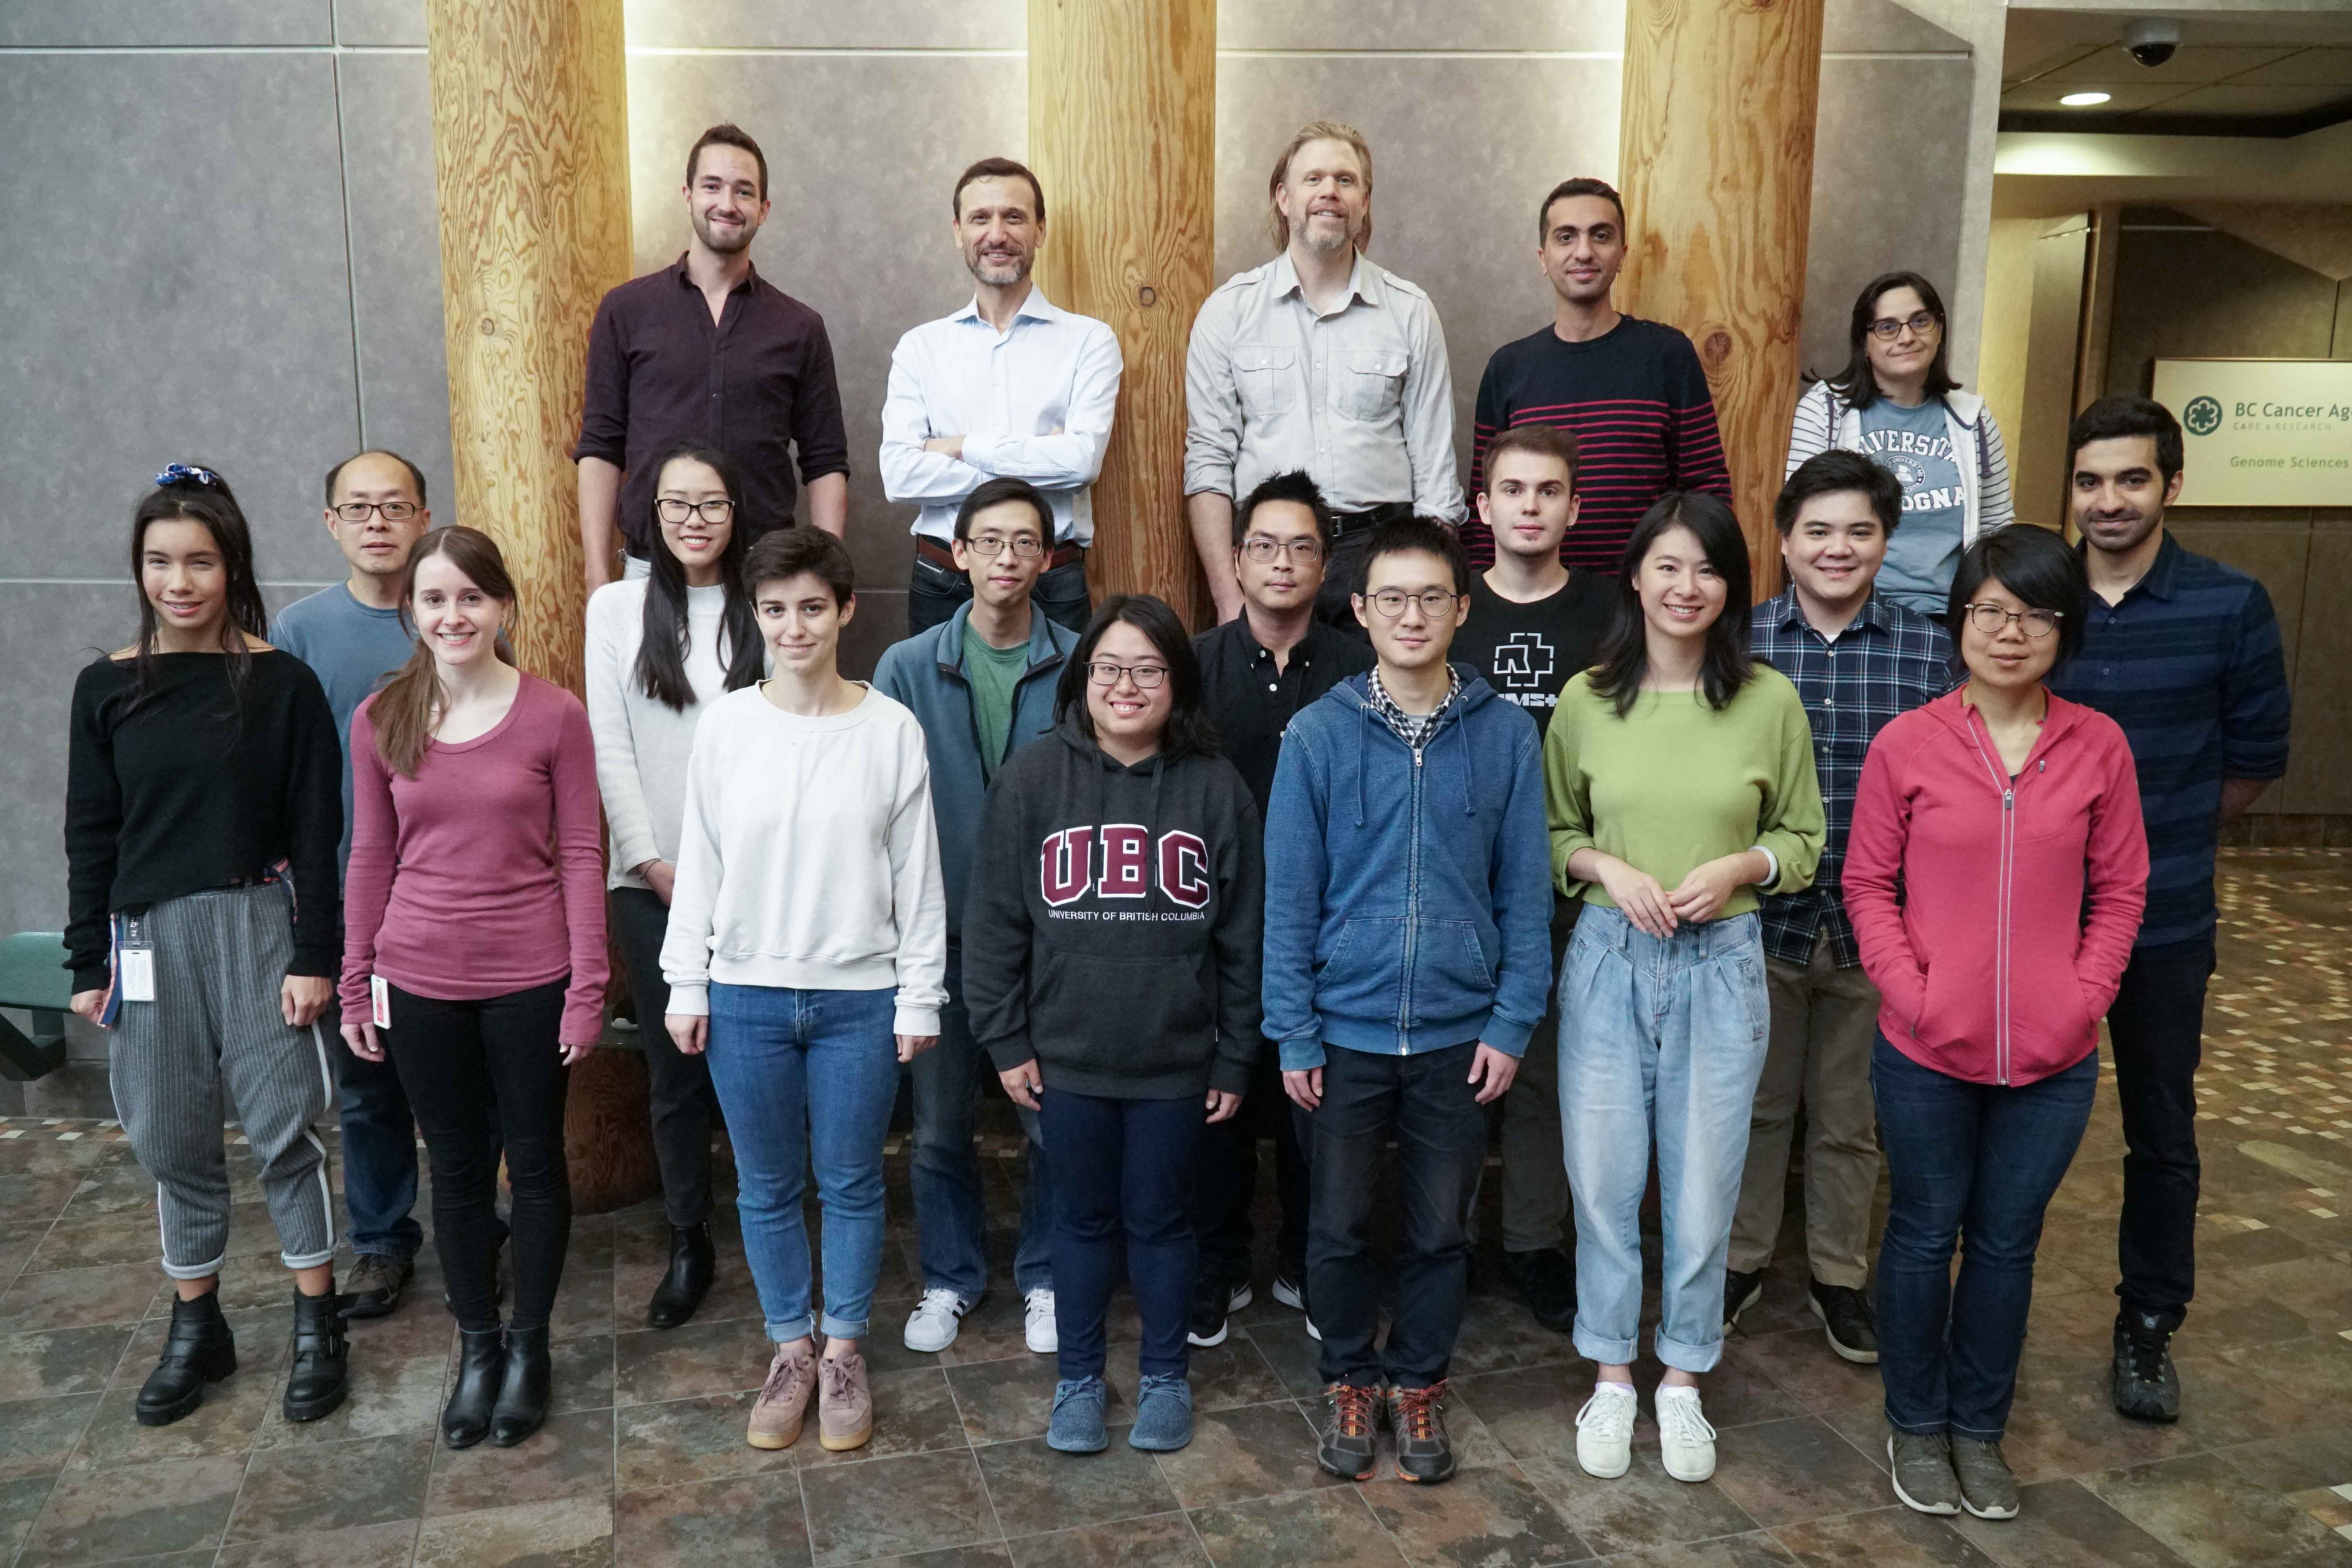
*former graduate students
To showcase their tool, the researchers used RNA-Scoop to visualize transcripts from two mouse single-cell transcriptomic datasets, highlighting the effectiveness of RNA-Scoop at analyzing transcript expression across and within cell populations.
According to one of the lead authors of the publication, Ka Ming Nip: “With an interactive graphical user interface, RNA-Scoop allows researchers to explore their scRNA-seq datasets and look for interesting patterns in transcript expression levels. We aimed to provide a dynamic visualization that is updated when certain entities of interests (e.g., genes, transcripts, cells) are selected with just a few mouse-clicks.”
Acknowledgements:
This study was supported by funding from the National Human Genome Research Institute of the National Institutes of Health, Genome British Columbia, and Genome Canada.
Image created with BioRender.com.
Learn more:
Learn more about the Birol Lab at the GSC and about their bioinformatics technology research
Learn about other bioinformatics tools and software for analyzing sequencing data
Citation:
Stephenson M†, Nip KM†, HafezQorani S, Gagalova KK, Yang C, Warren RL, and Birol, I. (2021) RNA-Scoop: interactive visualization of transcripts in single-cell transcriptomes. NAR Genomics and Bioinformatics 3(4): lqab105.
*bold font indicates members of the GSC.
† indicates authors that contributed equally to this work