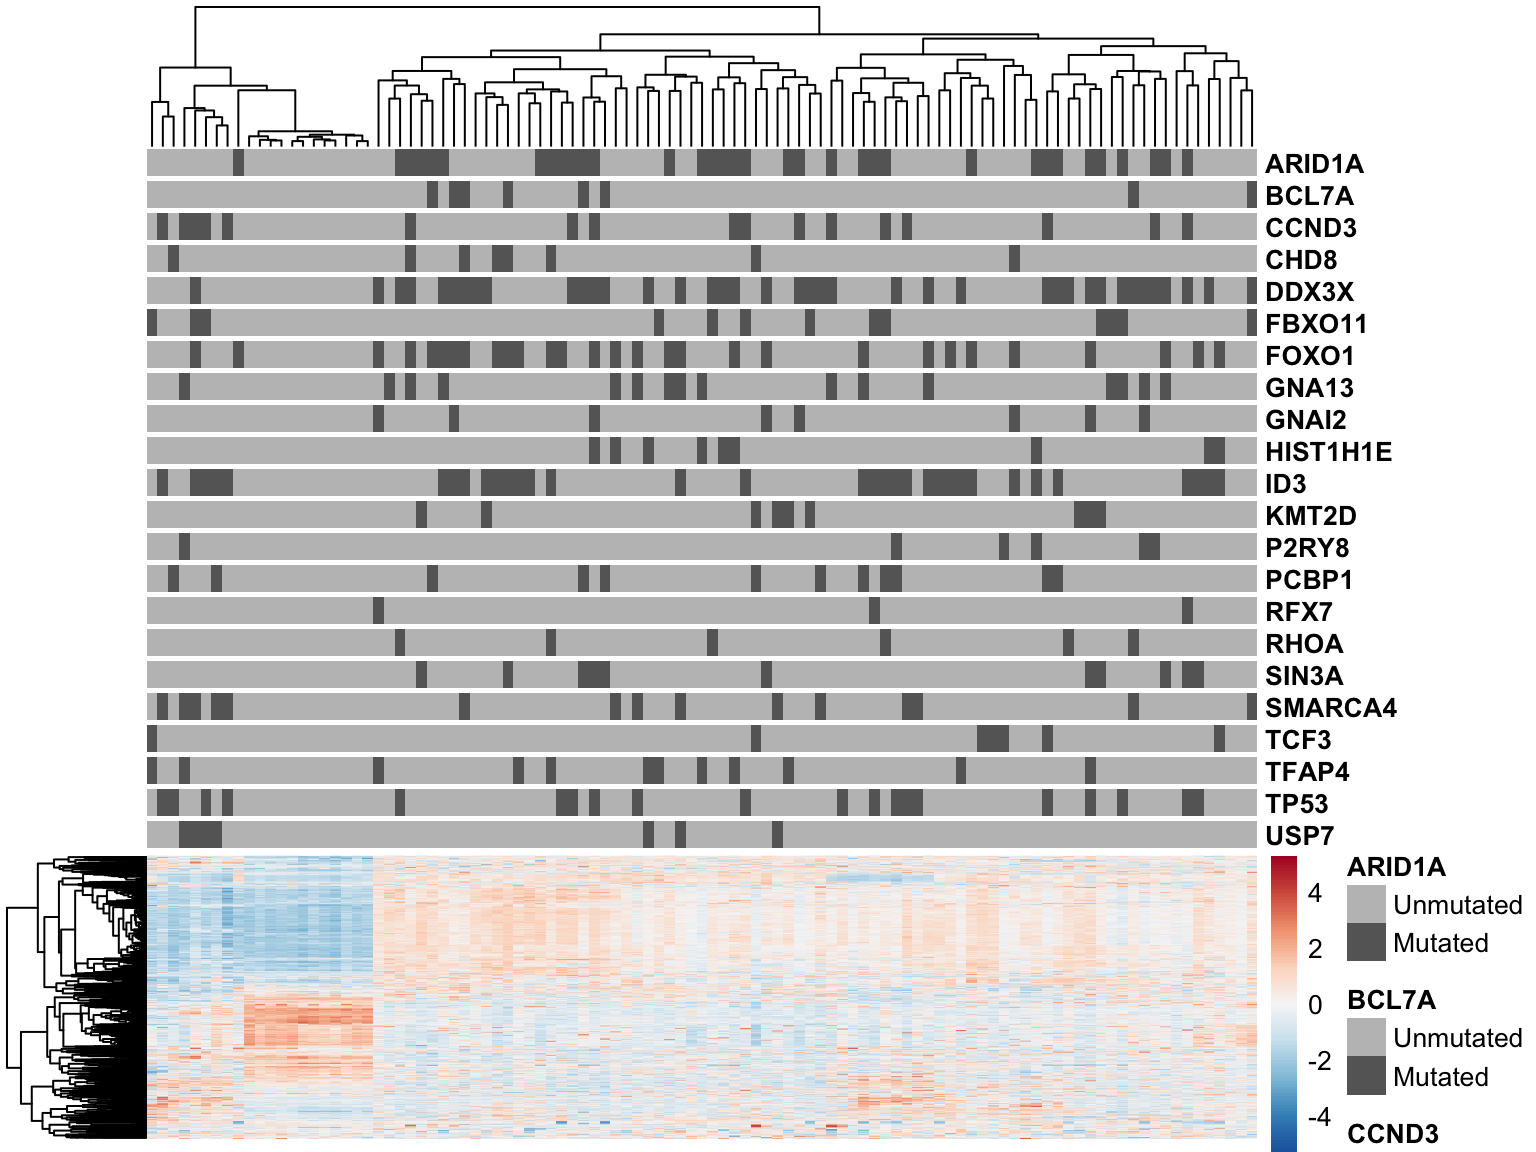
patients <- colnames(salmon$clean$counts)

mut_status <-
  maf@data %>%
  filter(
    grepl("p[.][^=]", HGVSp_Short),
    Consequence != "synonymous_variant",
    Hugo_Symbol %in% smgs,
    patient %in% patients) %>%
  select(patient, Hugo_Symbol) %>%
  distinct() %>%
  mutate(Status = "Mutated") %>%
  bind_rows(tibble(patient = patients, Hugo_Symbol = NA)) %>%
  spread(Hugo_Symbol, Status, fill = "Unmutated") %>%
  select(-`<NA>`) %>%
  as.data.frame() %>%
  remove_rownames() %>%
  column_to_rownames("patient")

mut_colours <- list()
for (gene in names(mut_status)) mut_colours[[gene]] <- c(Unmutated = "grey75", Mutated = "grey40")
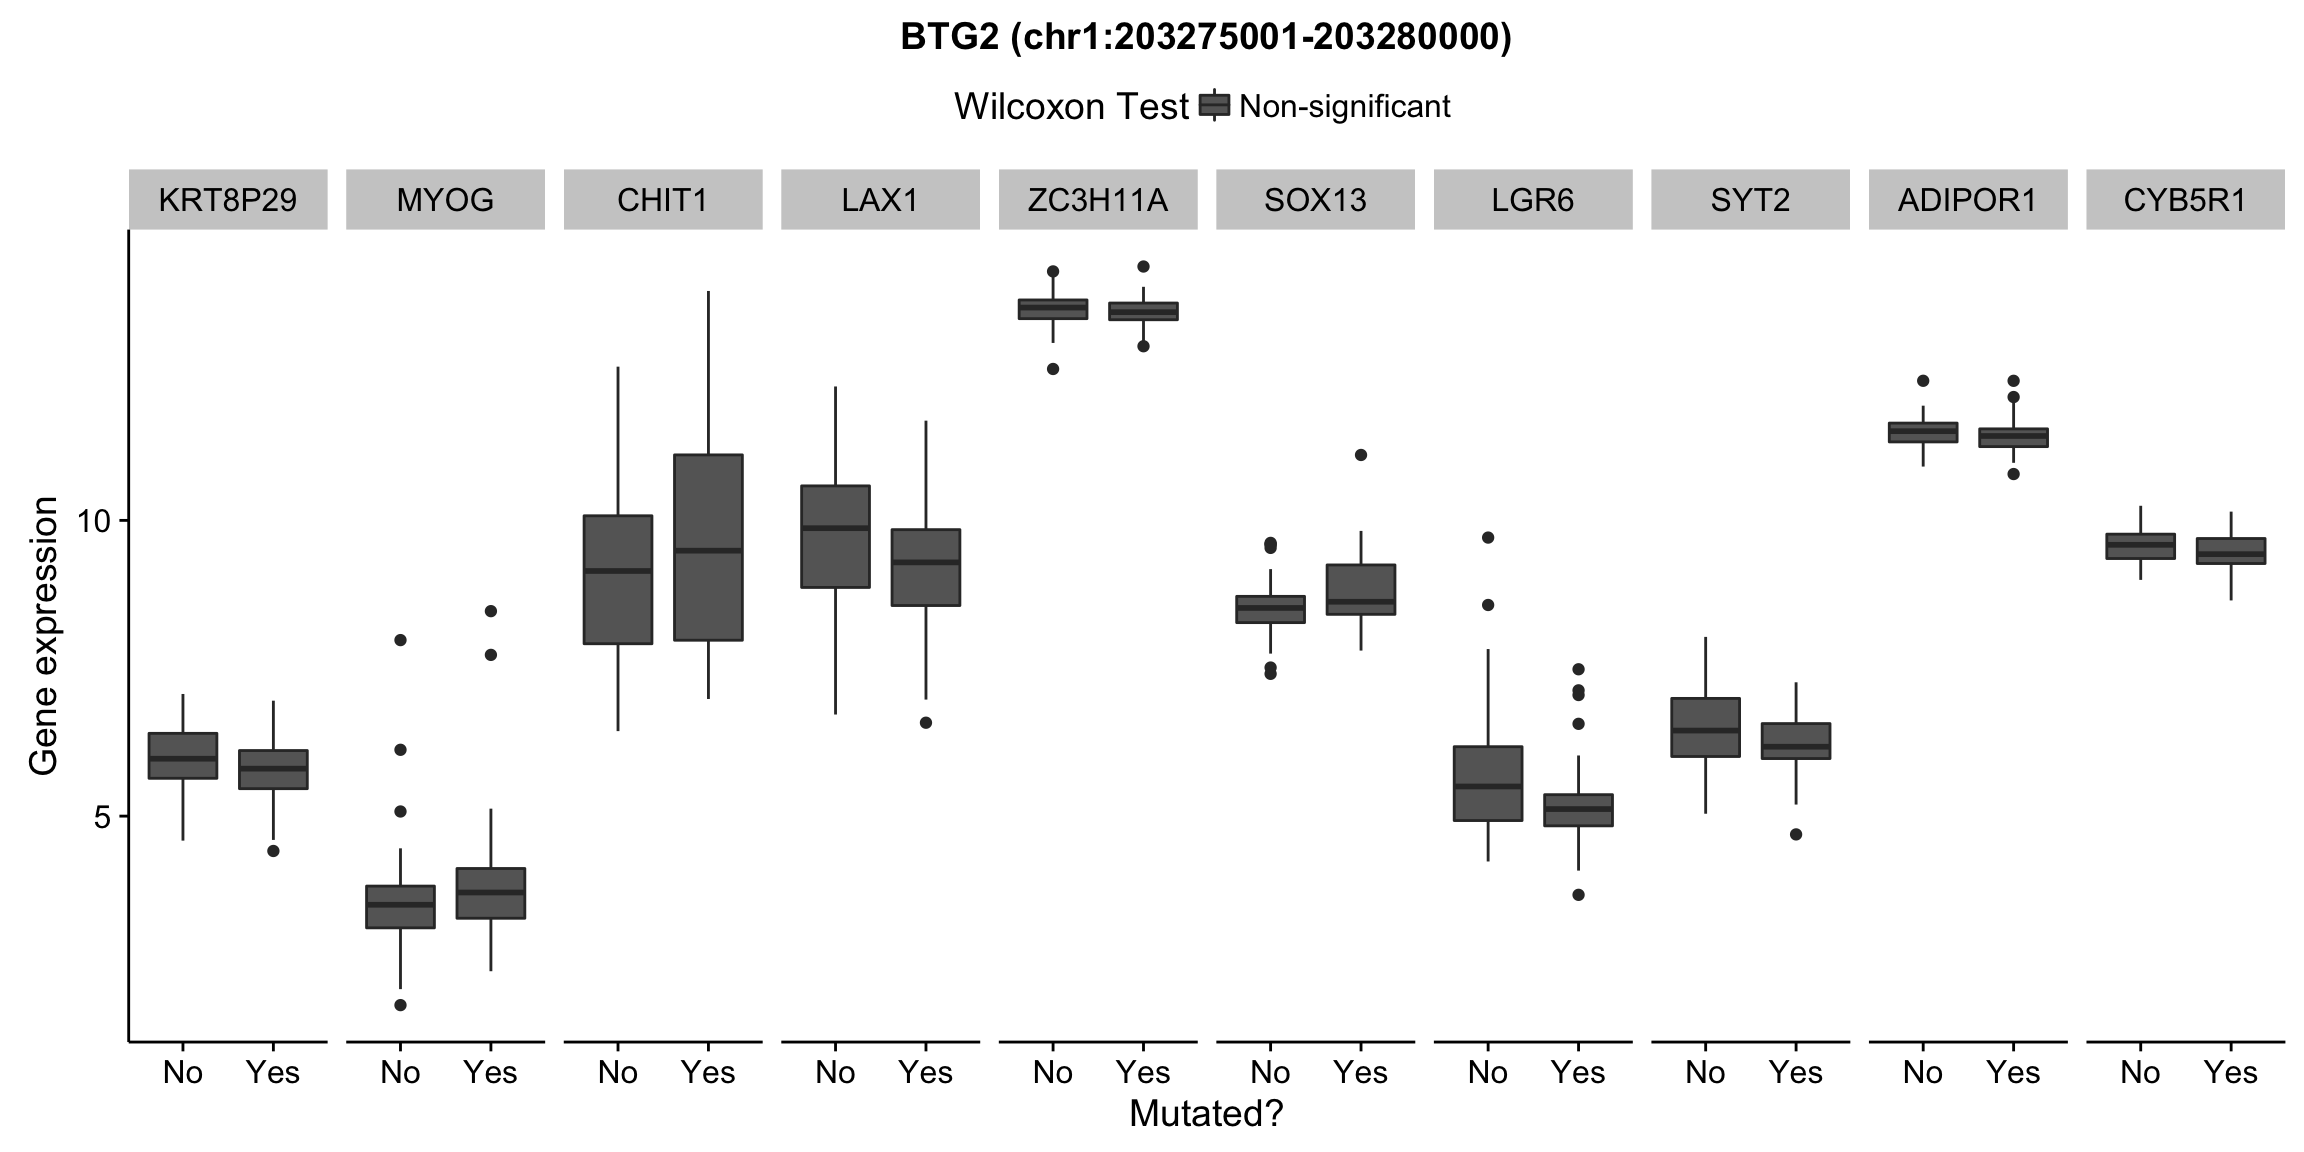
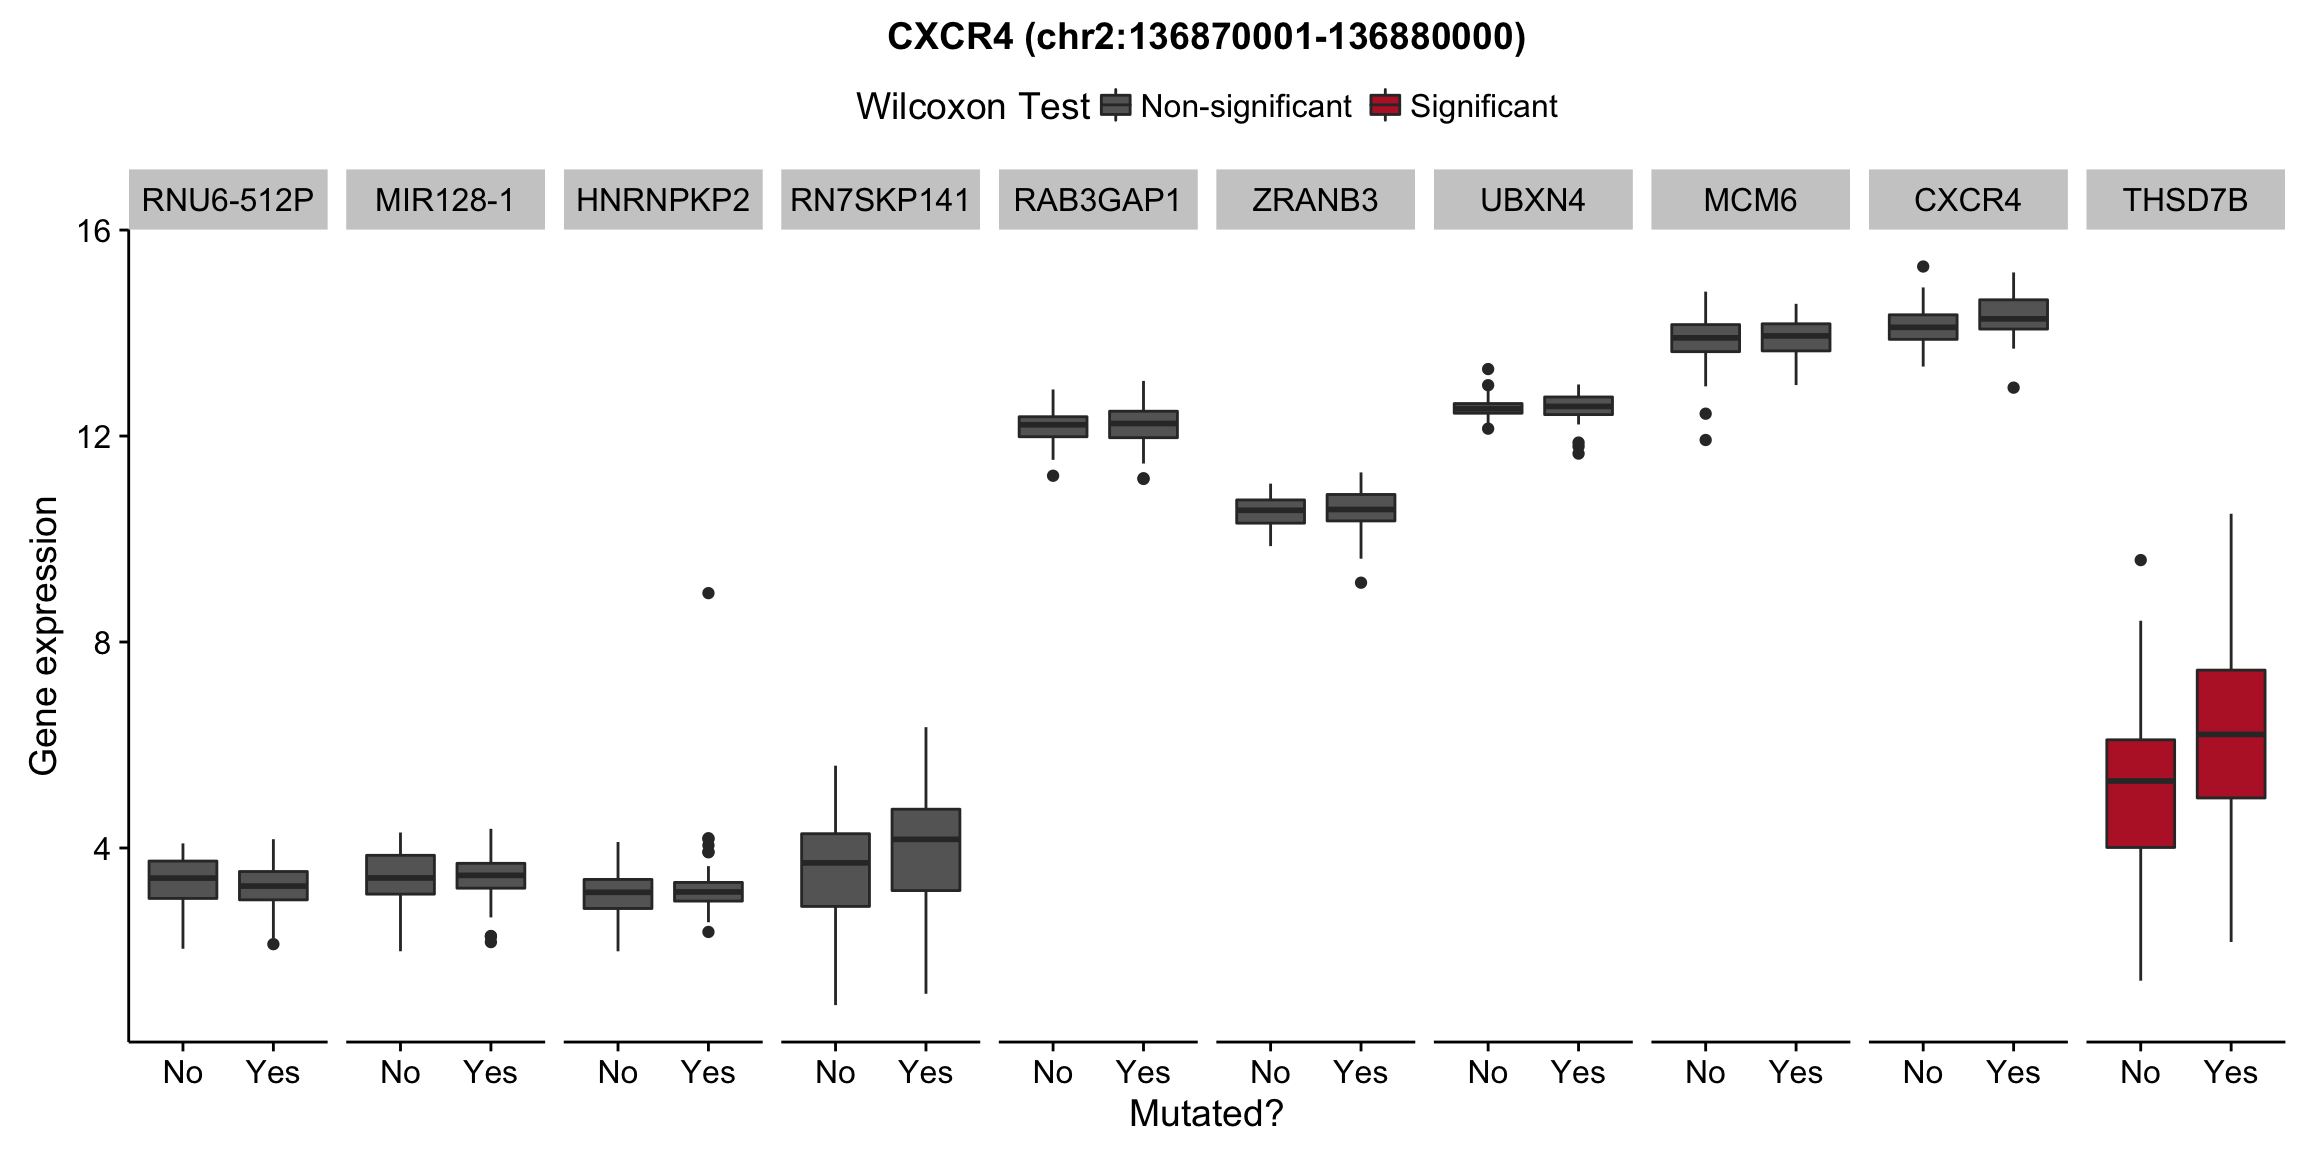
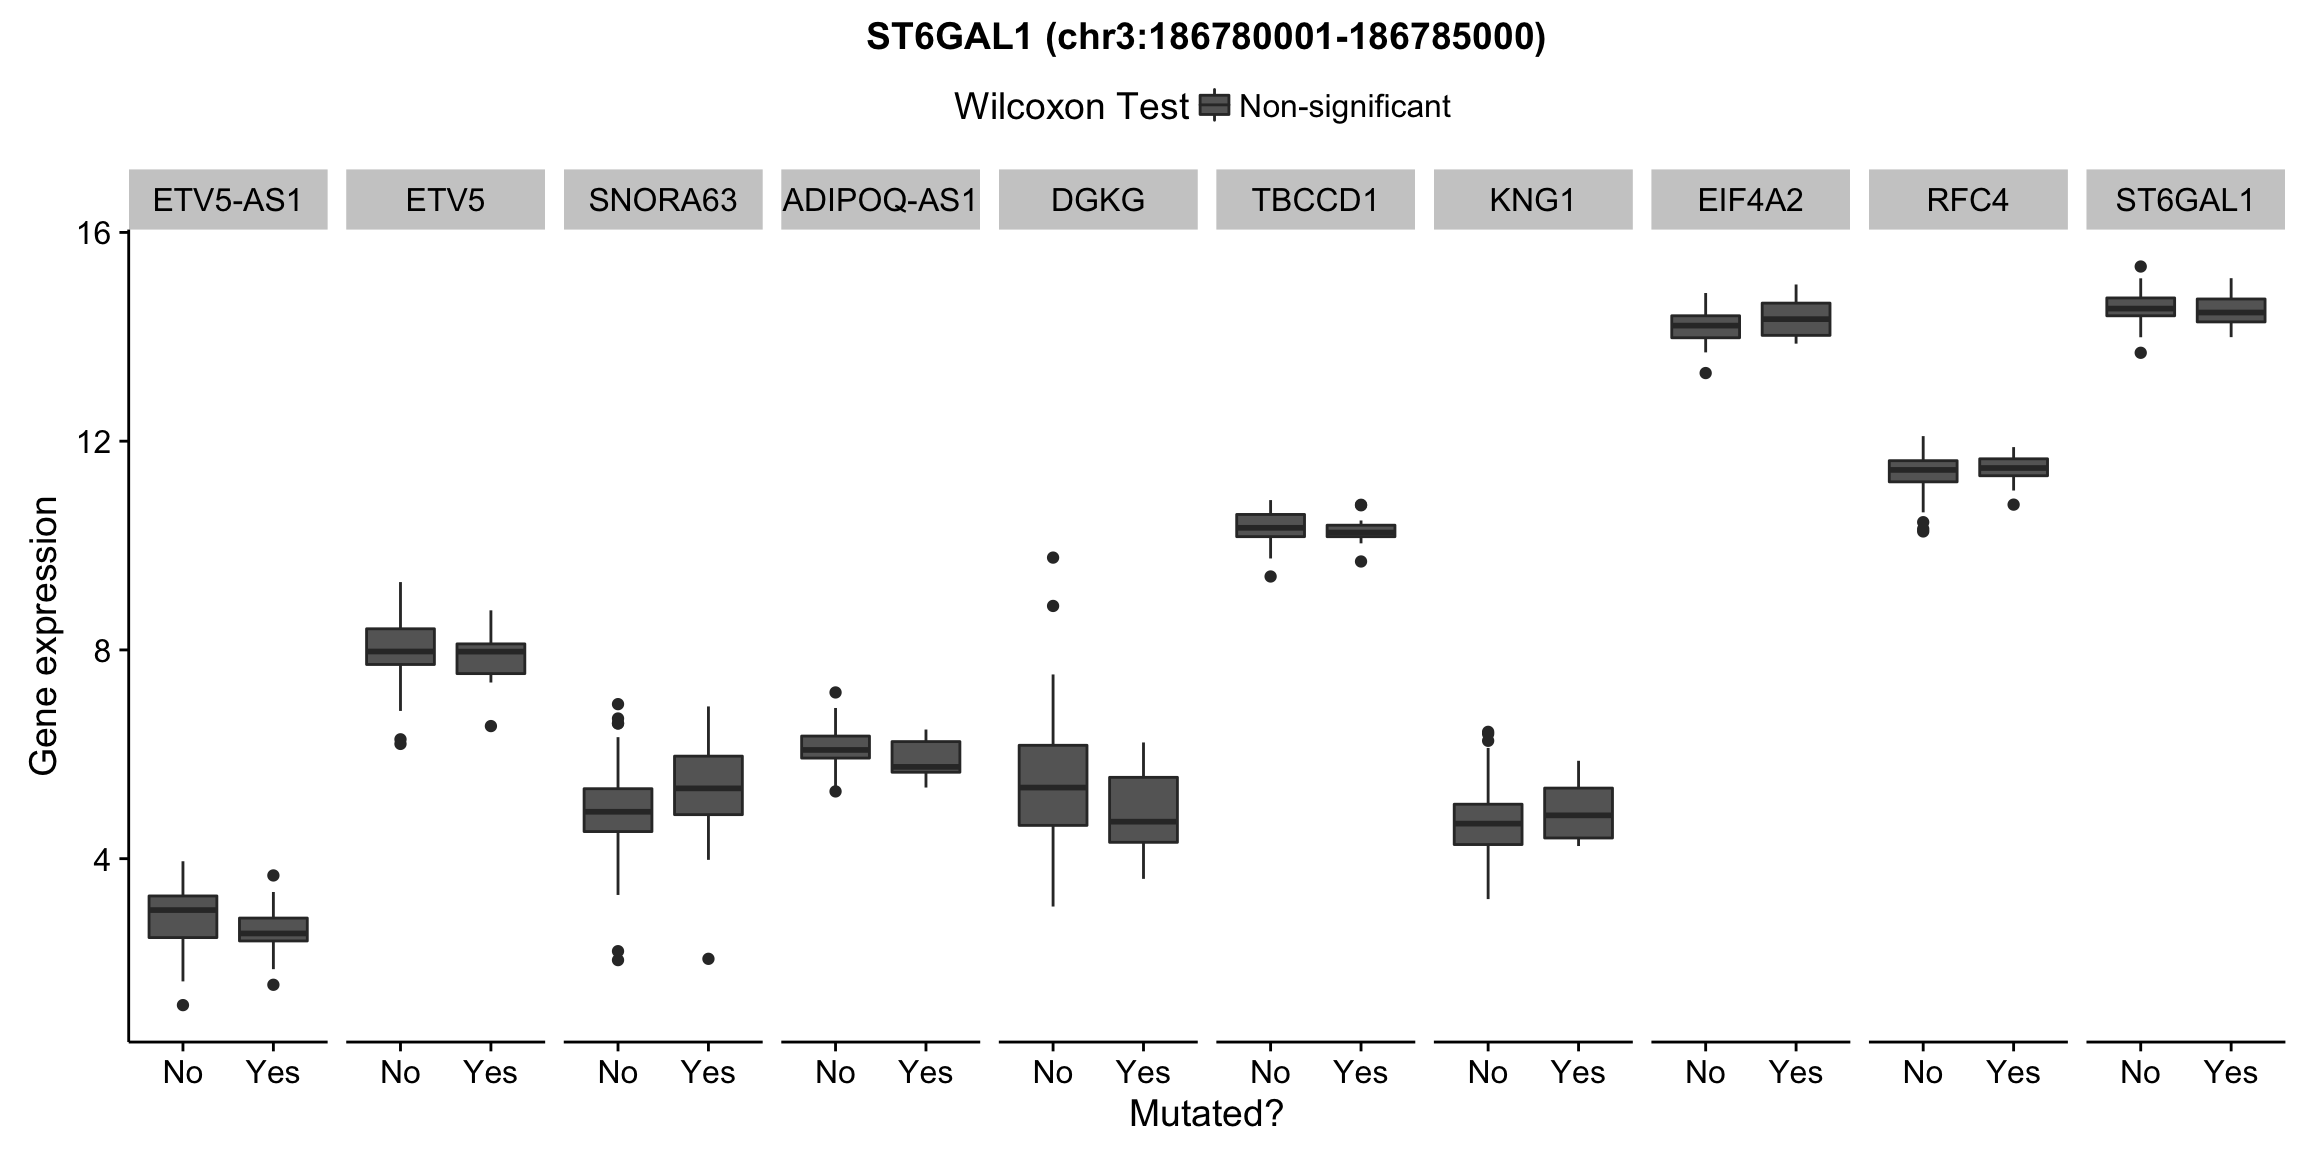
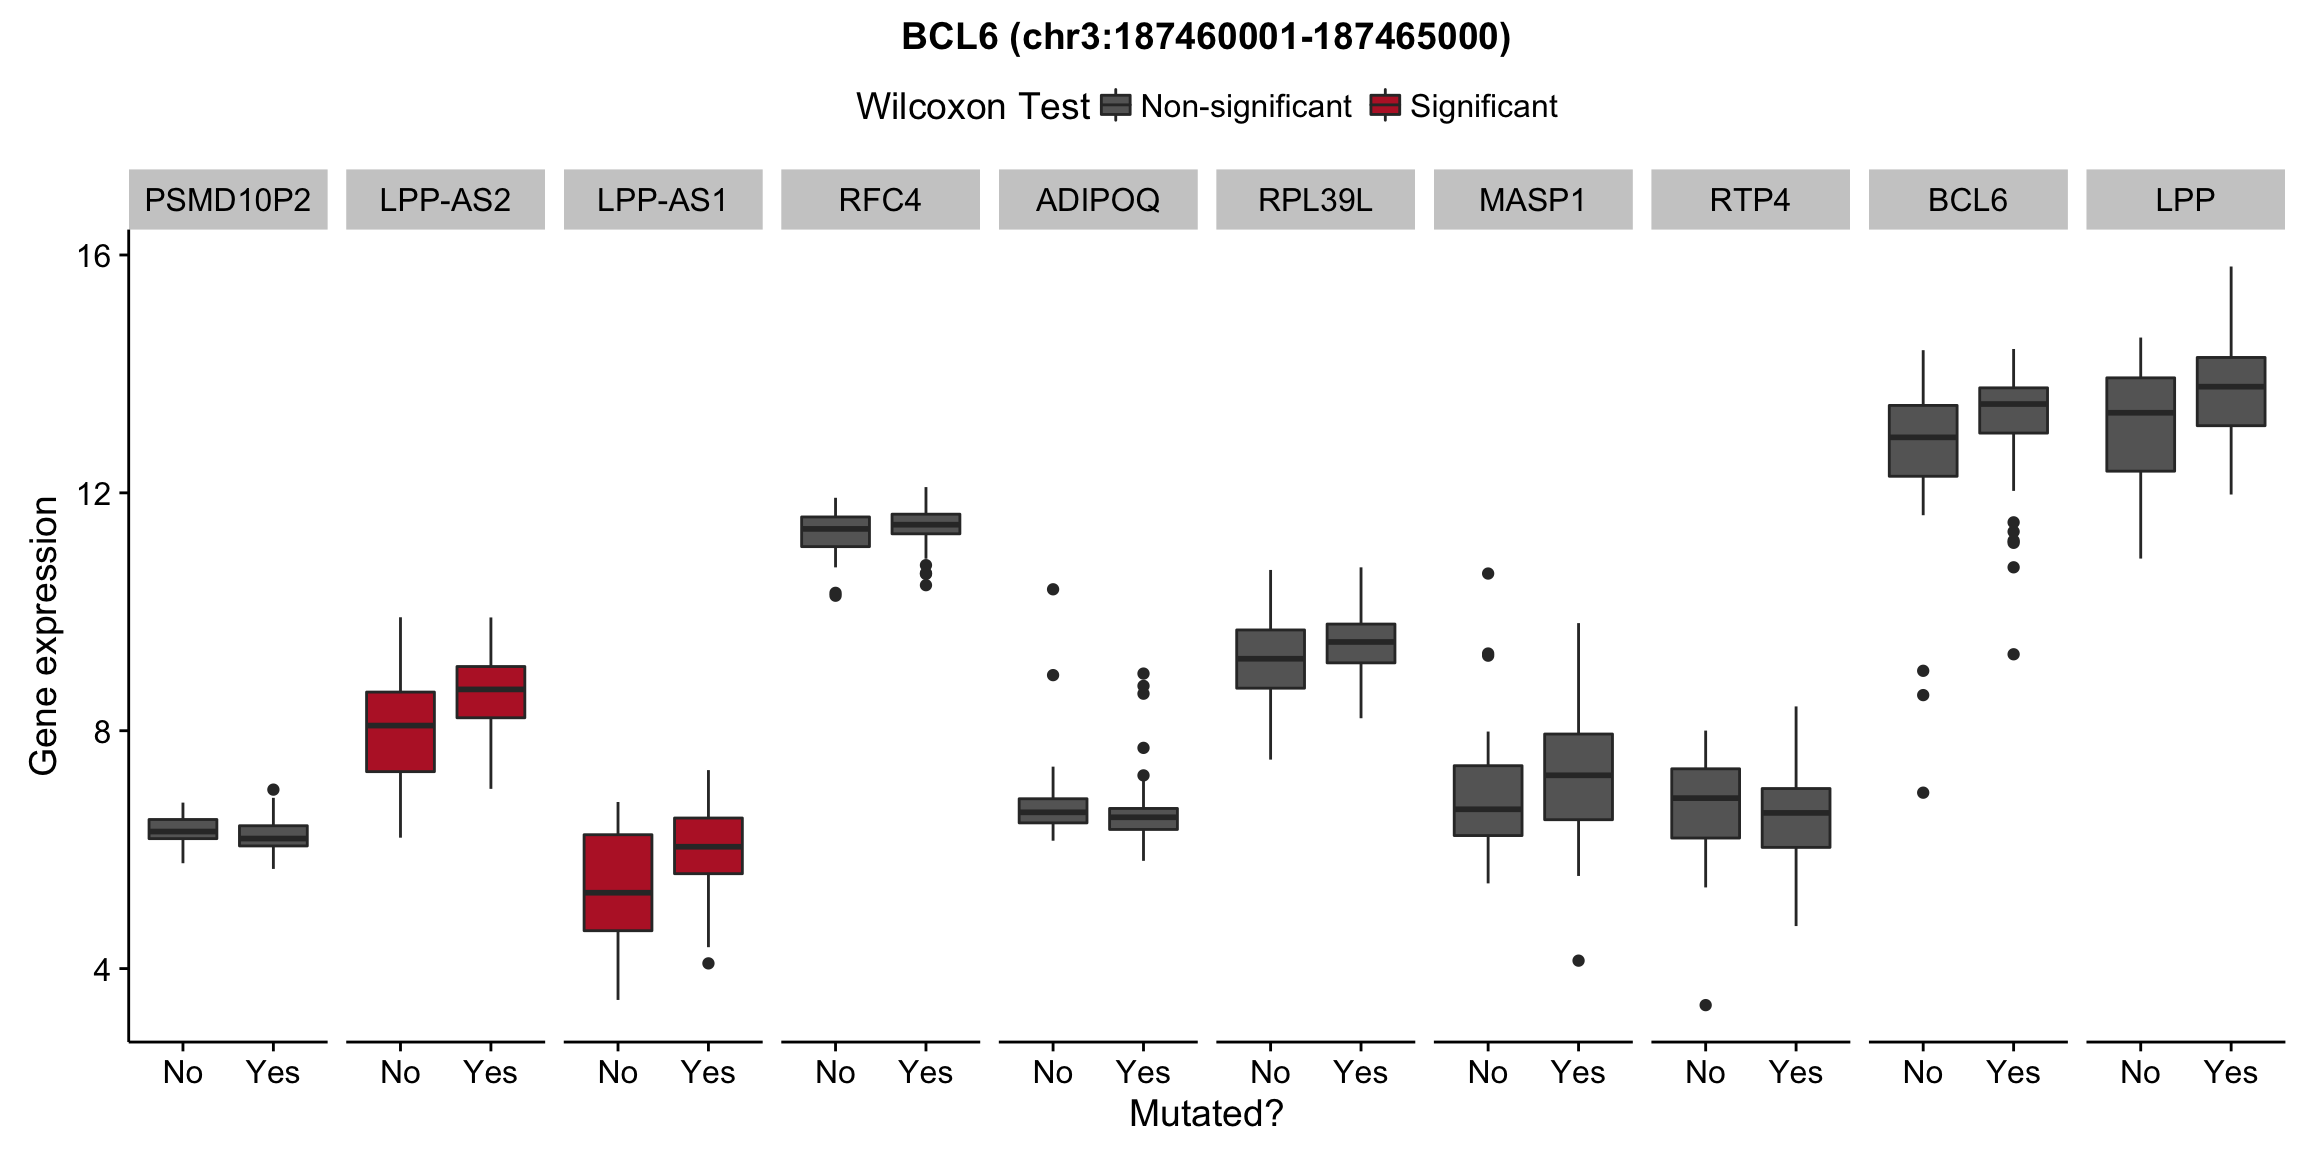
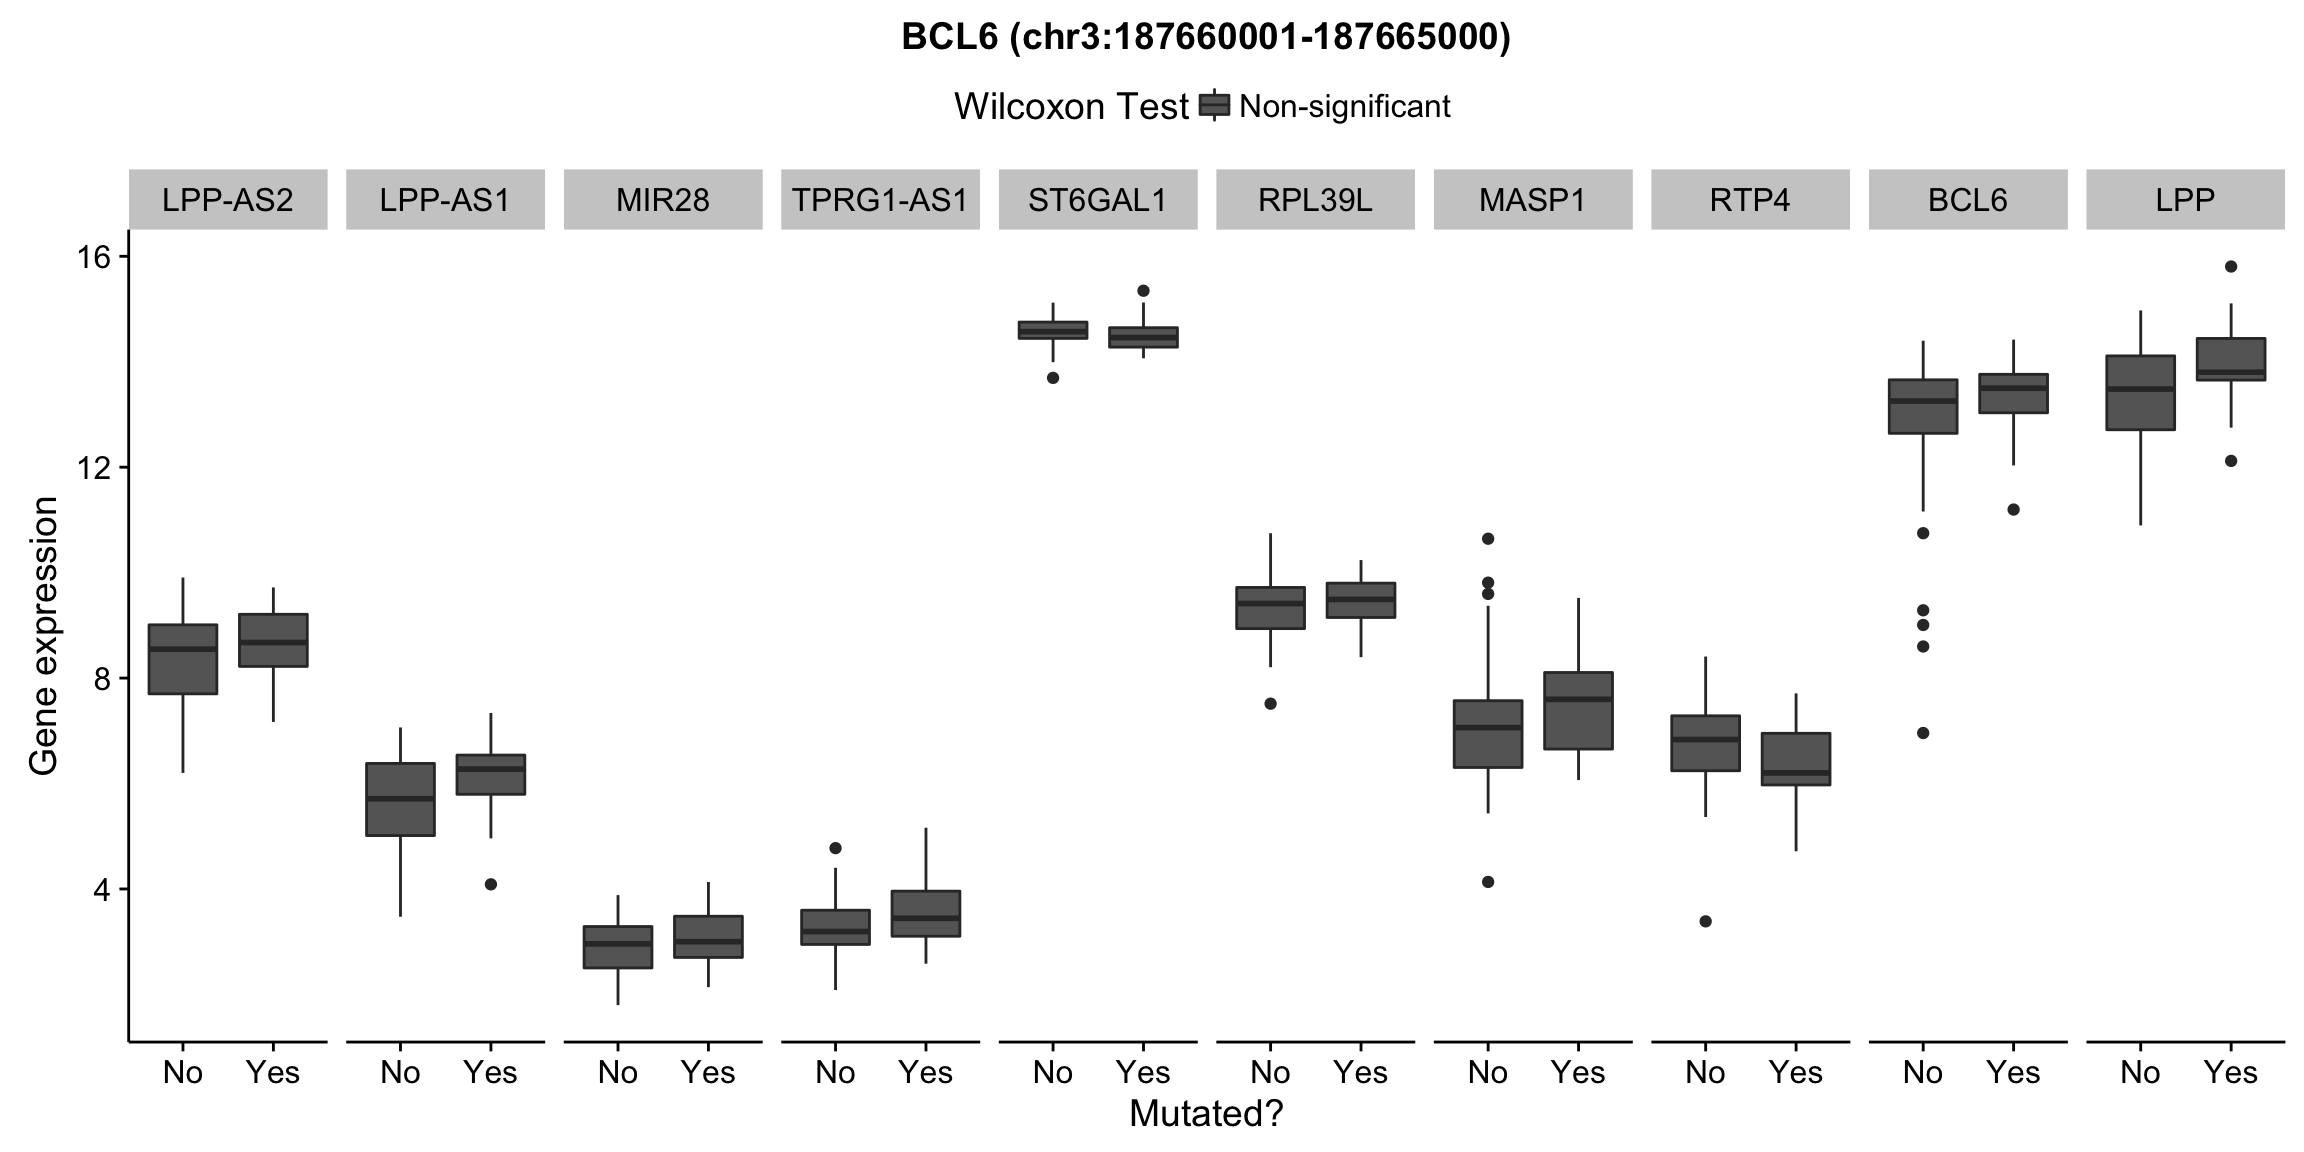
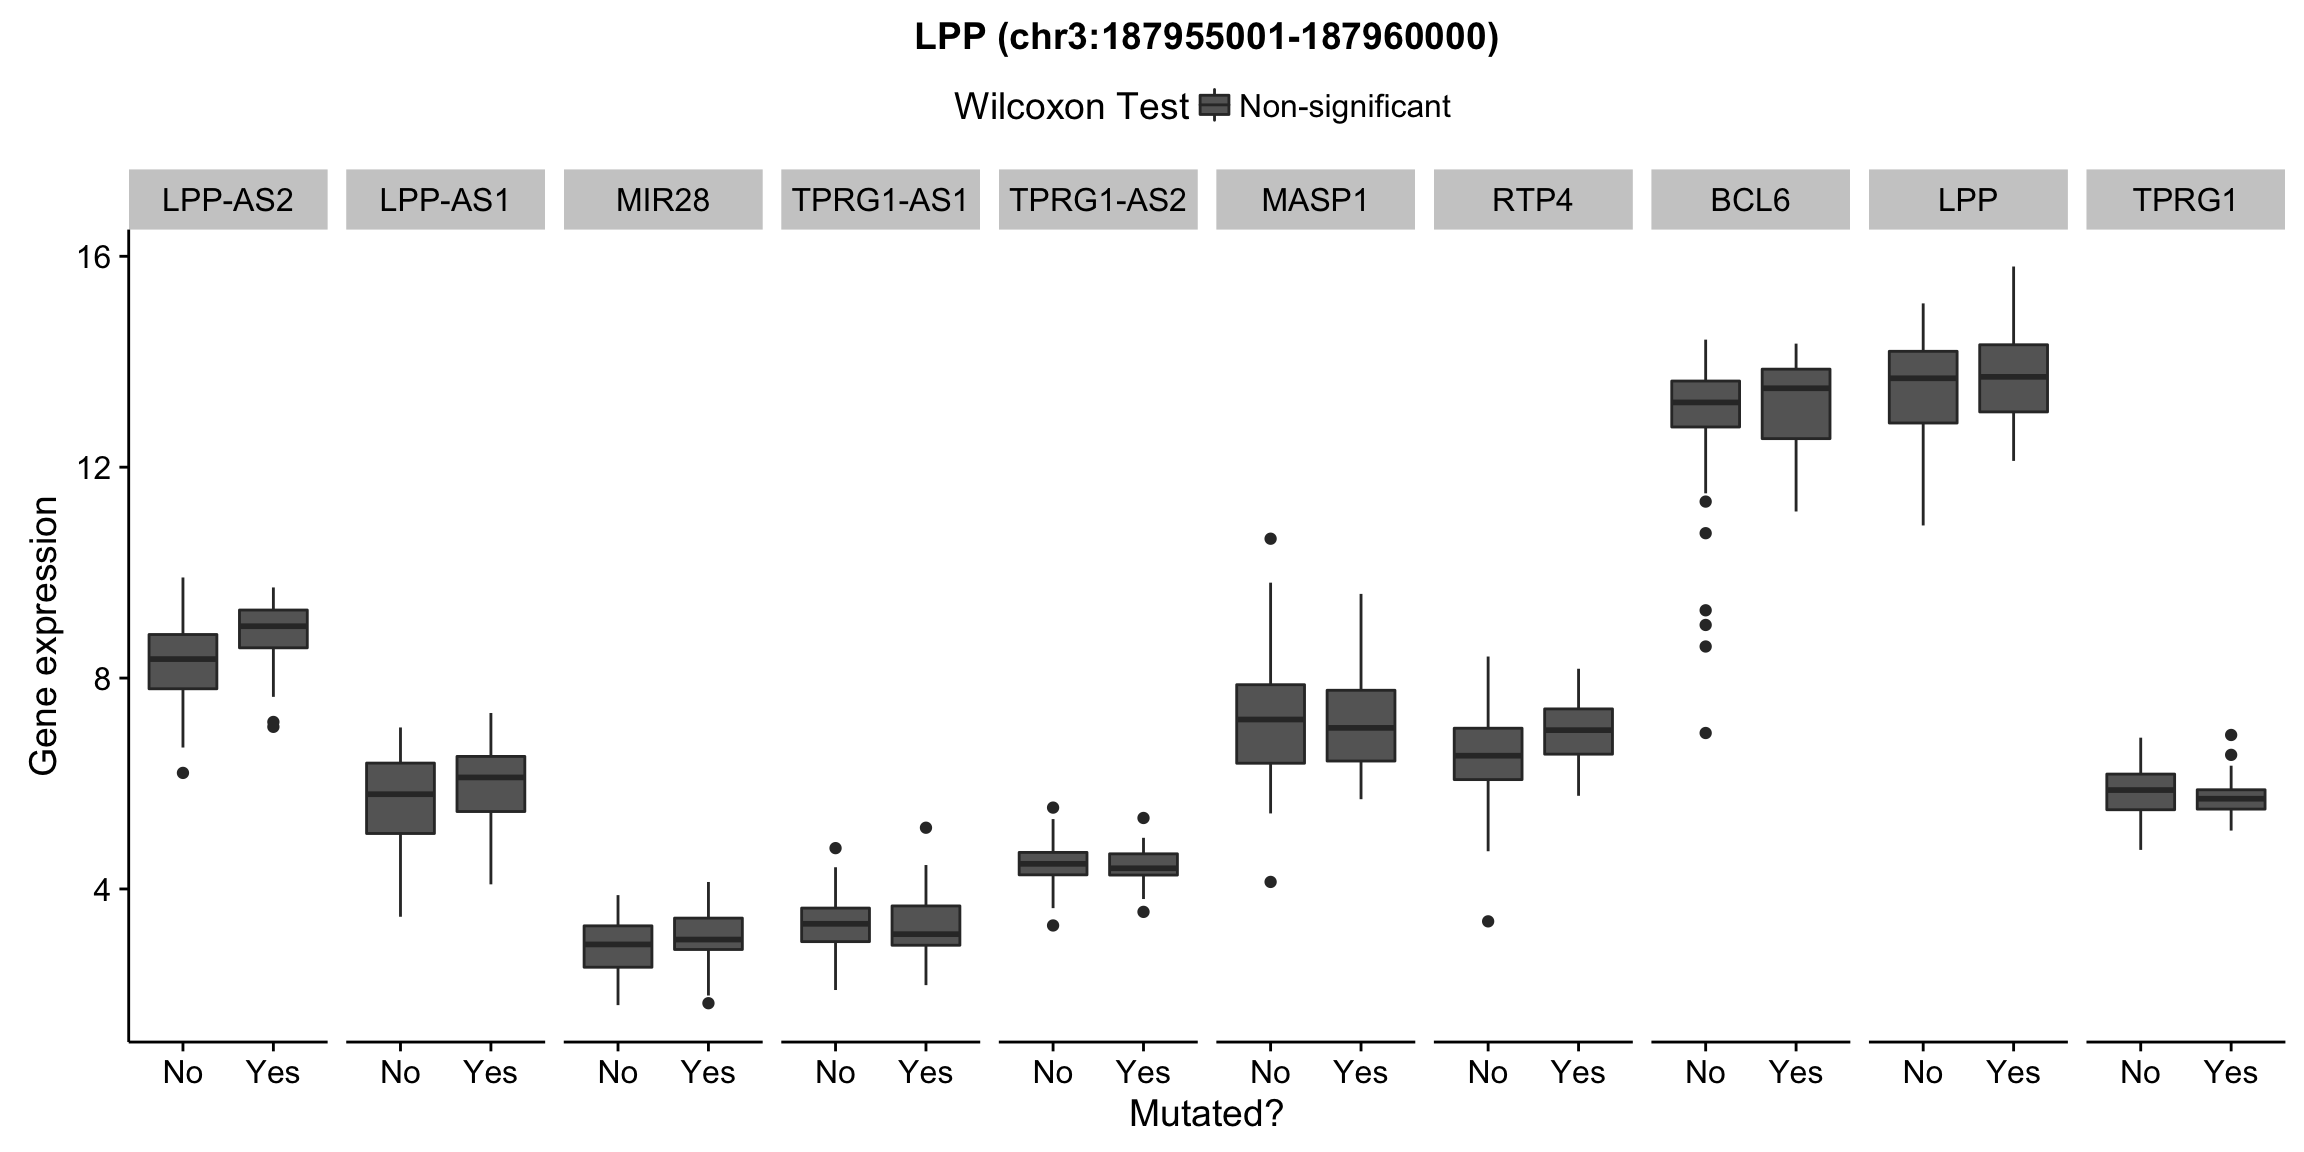
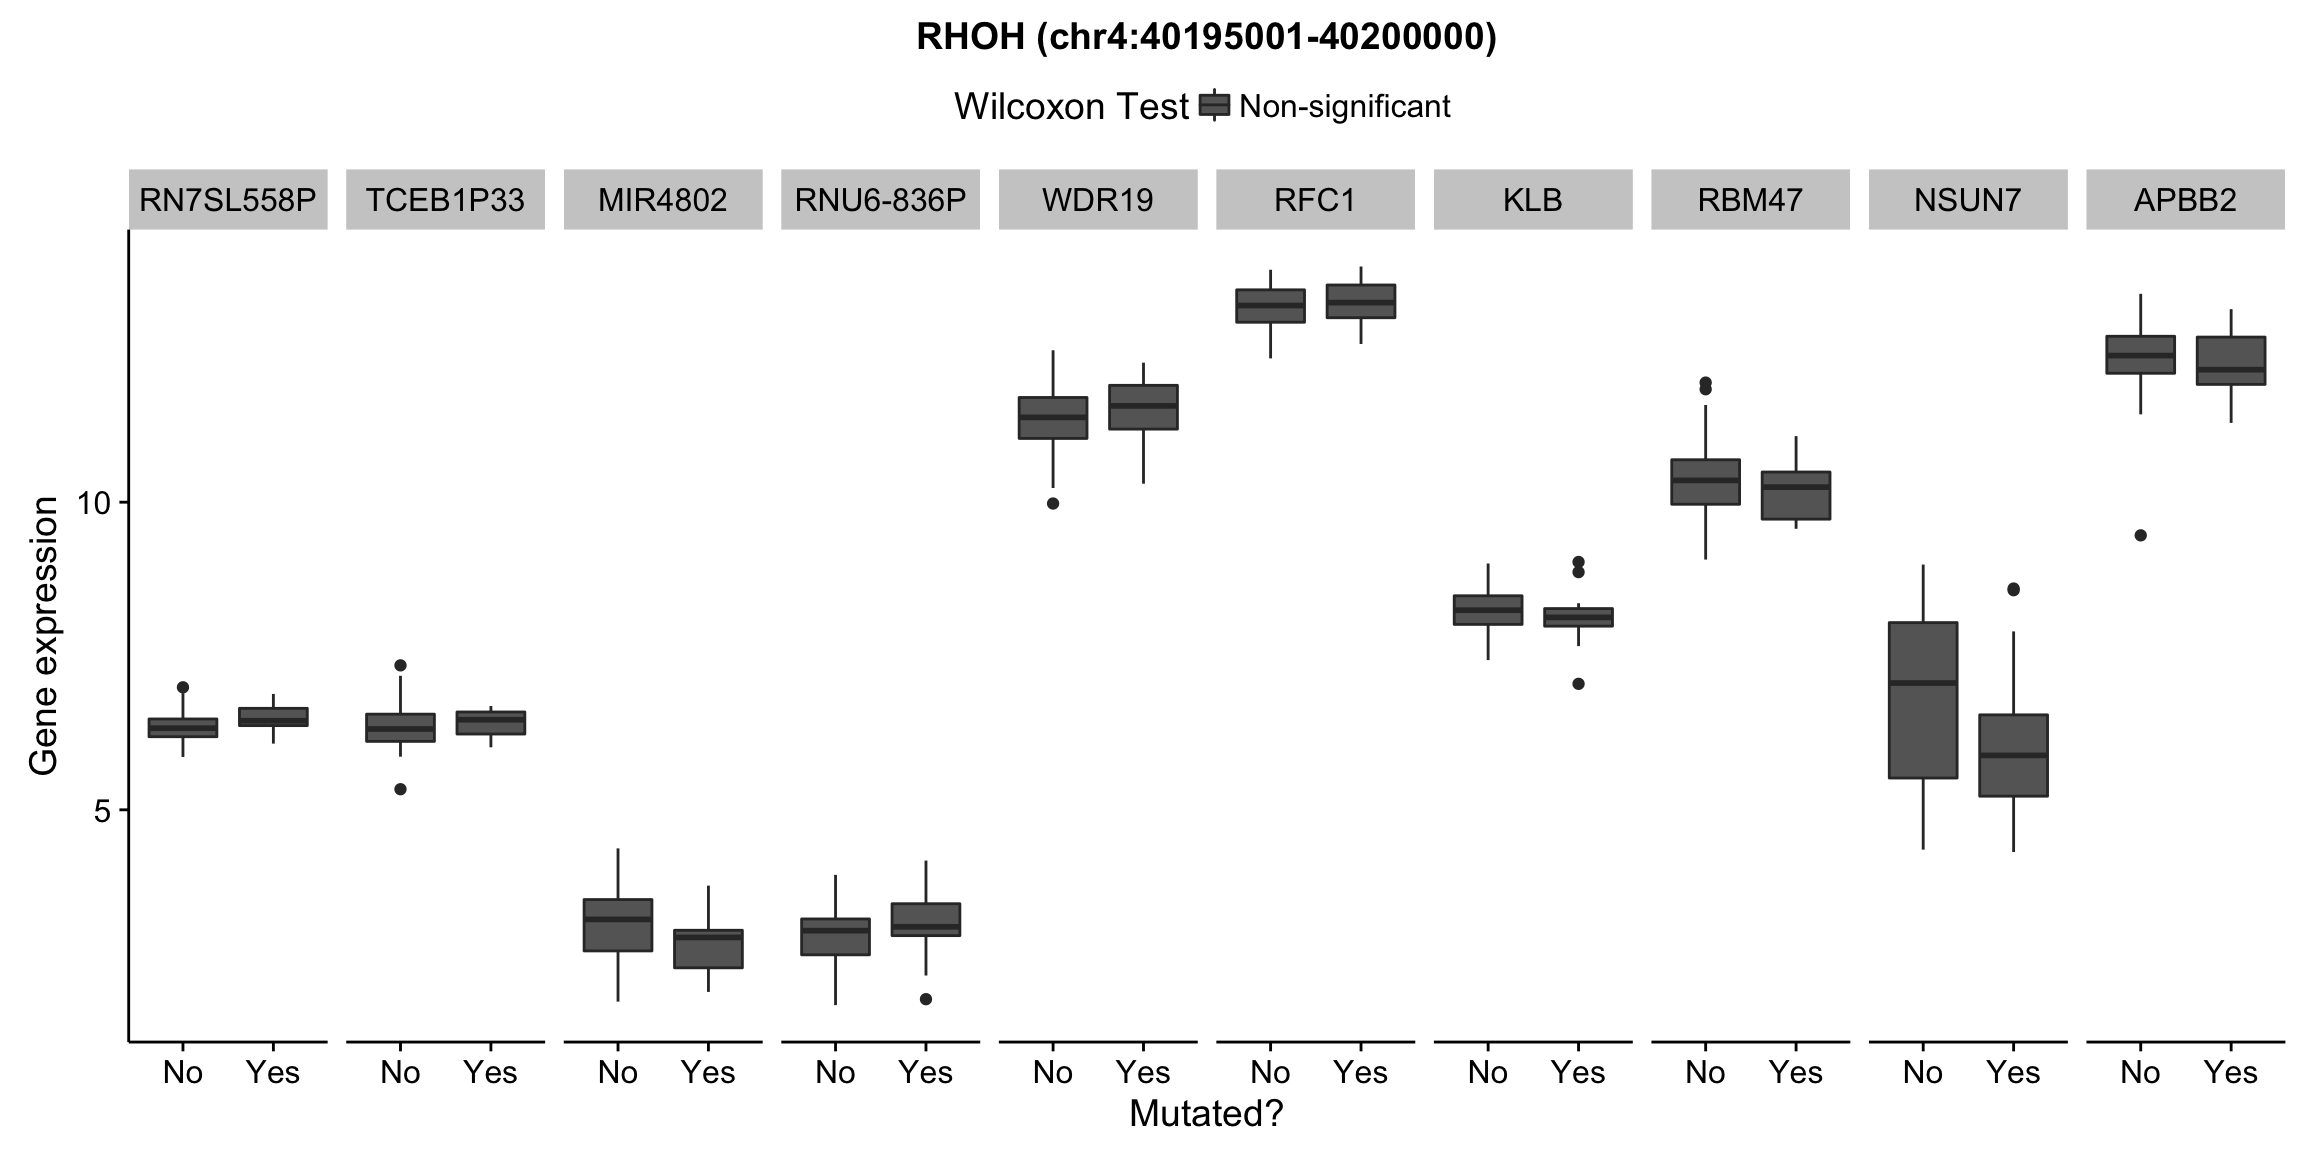
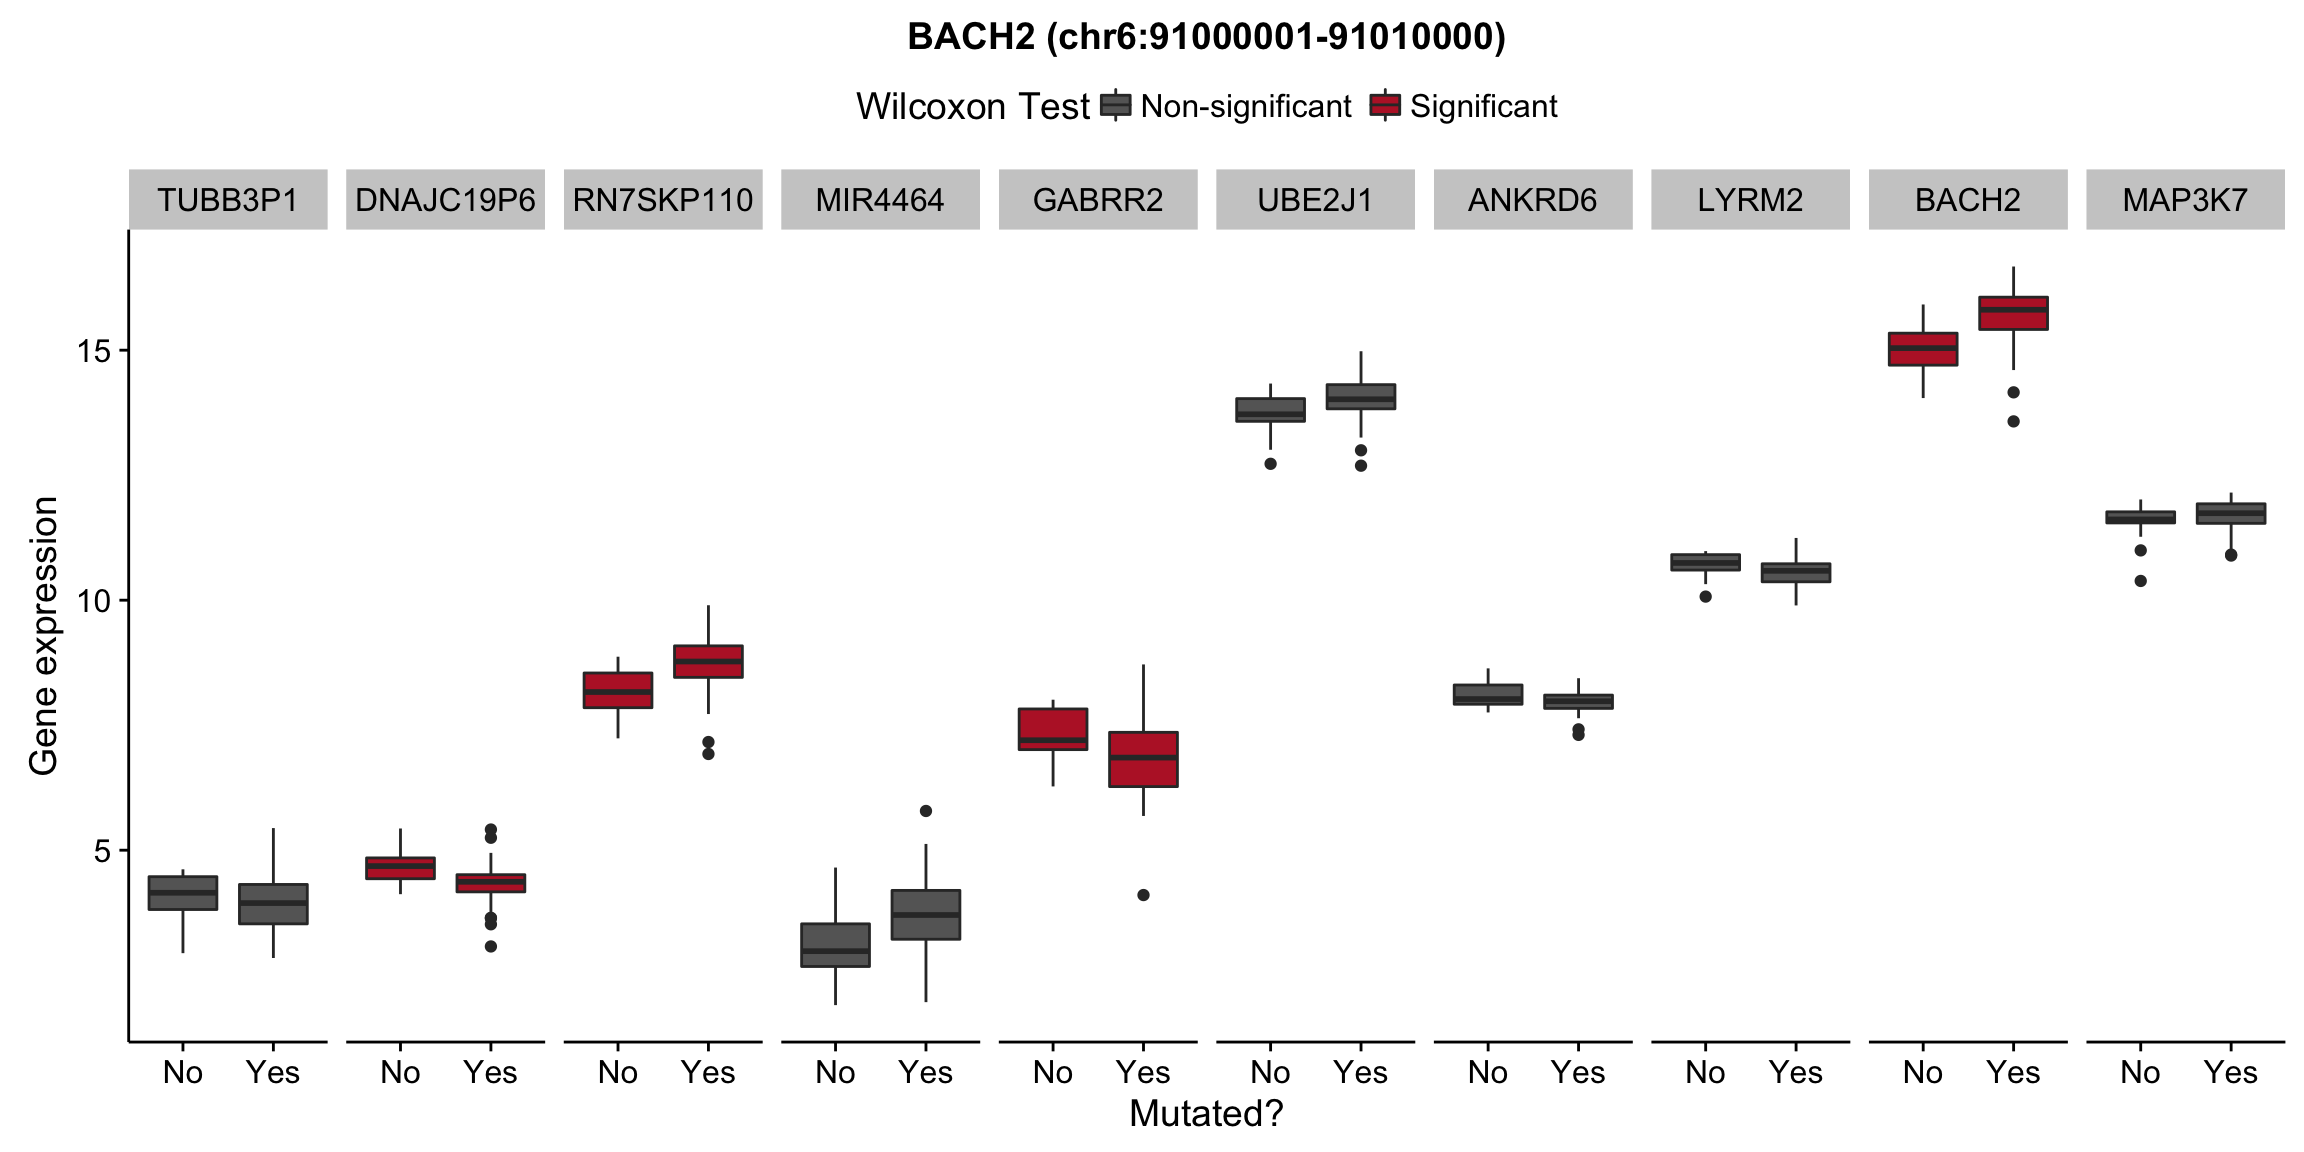
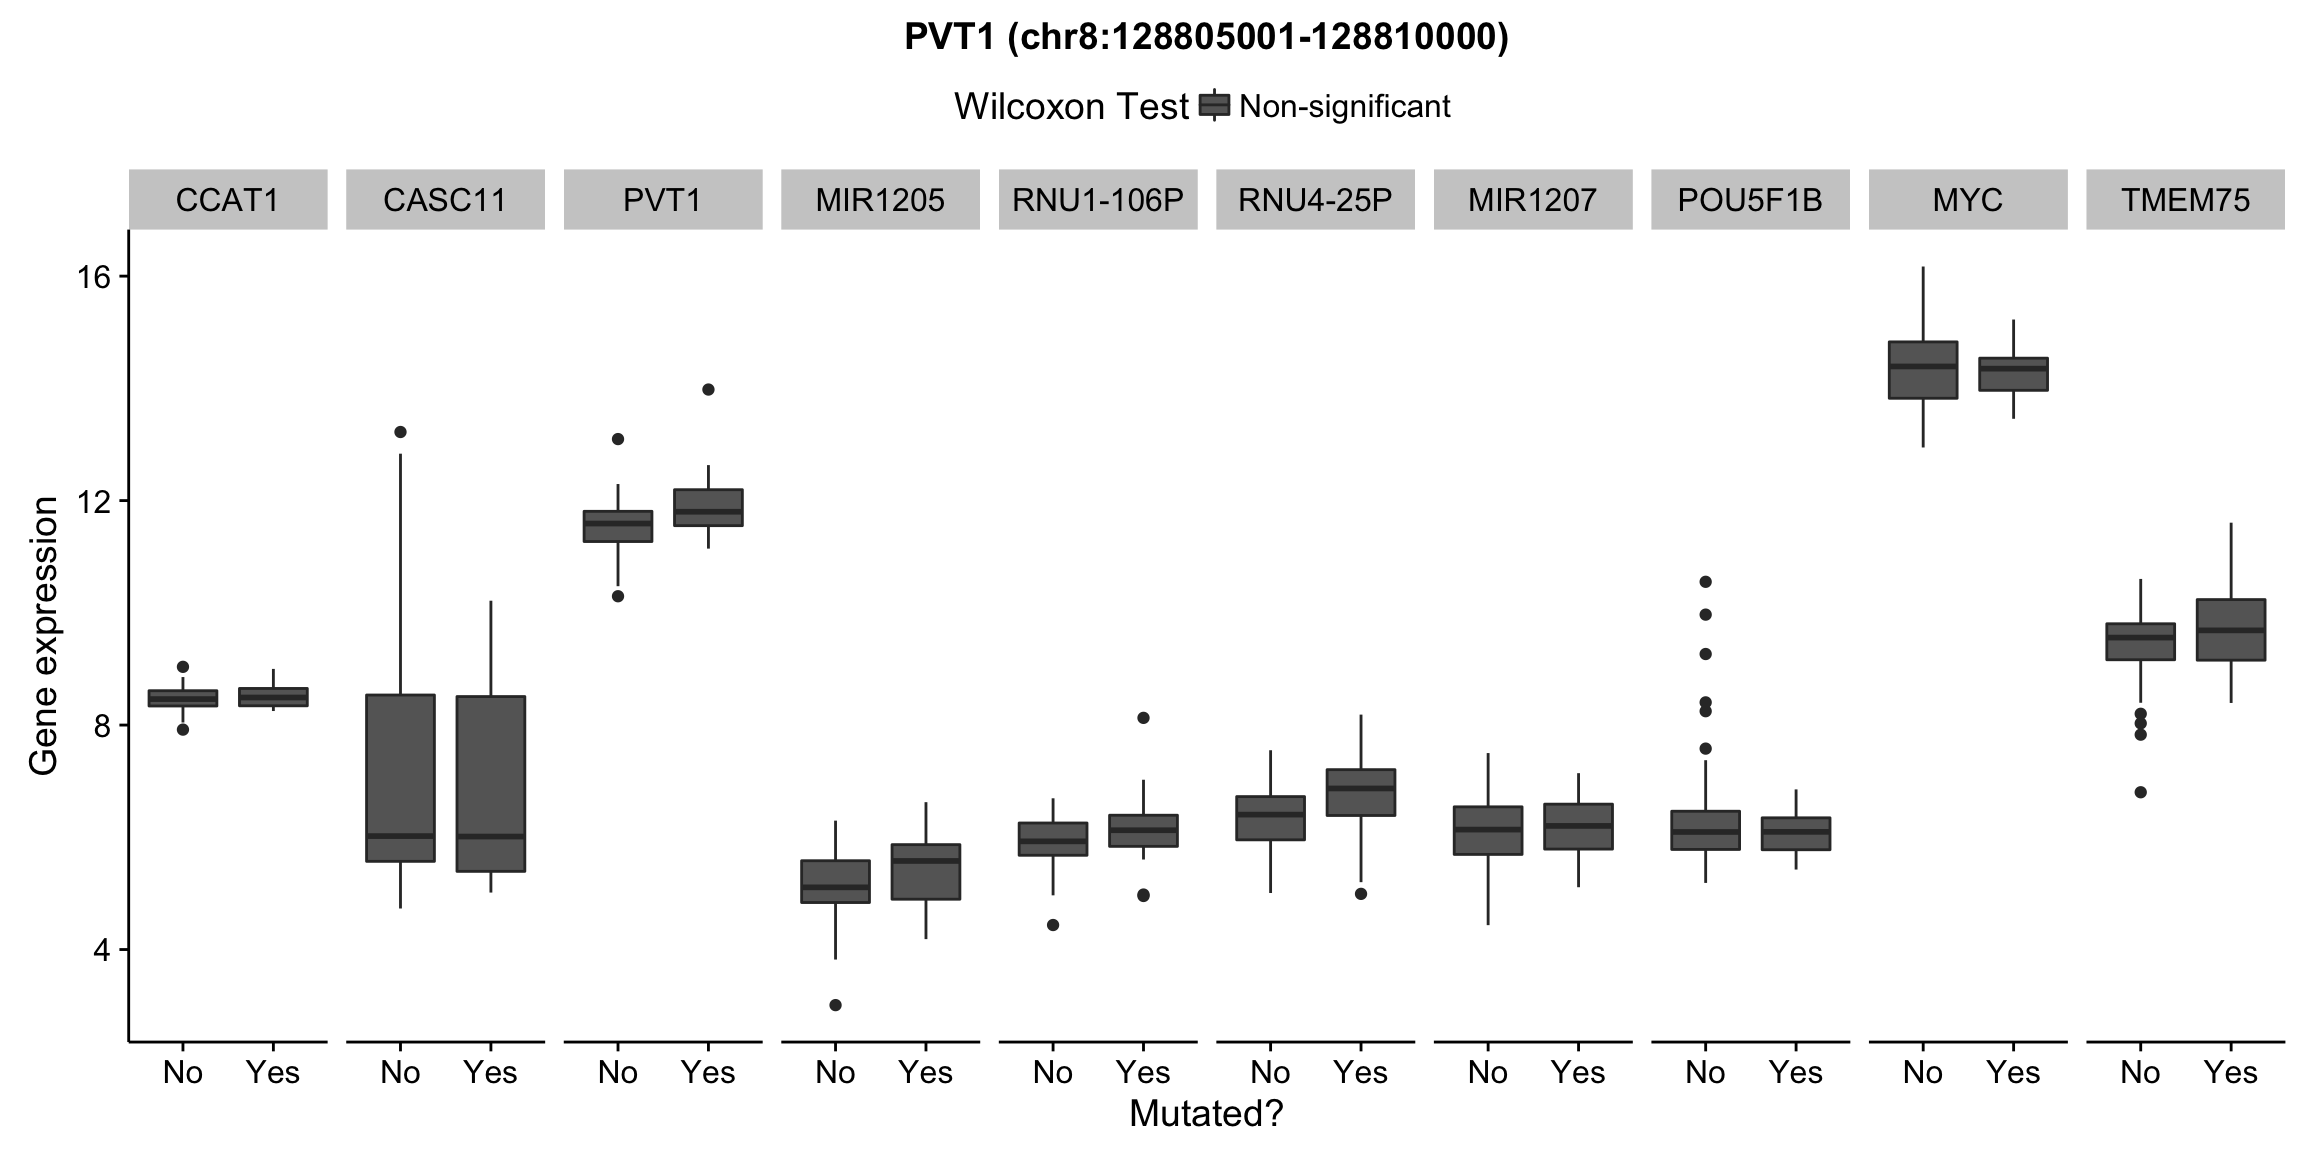
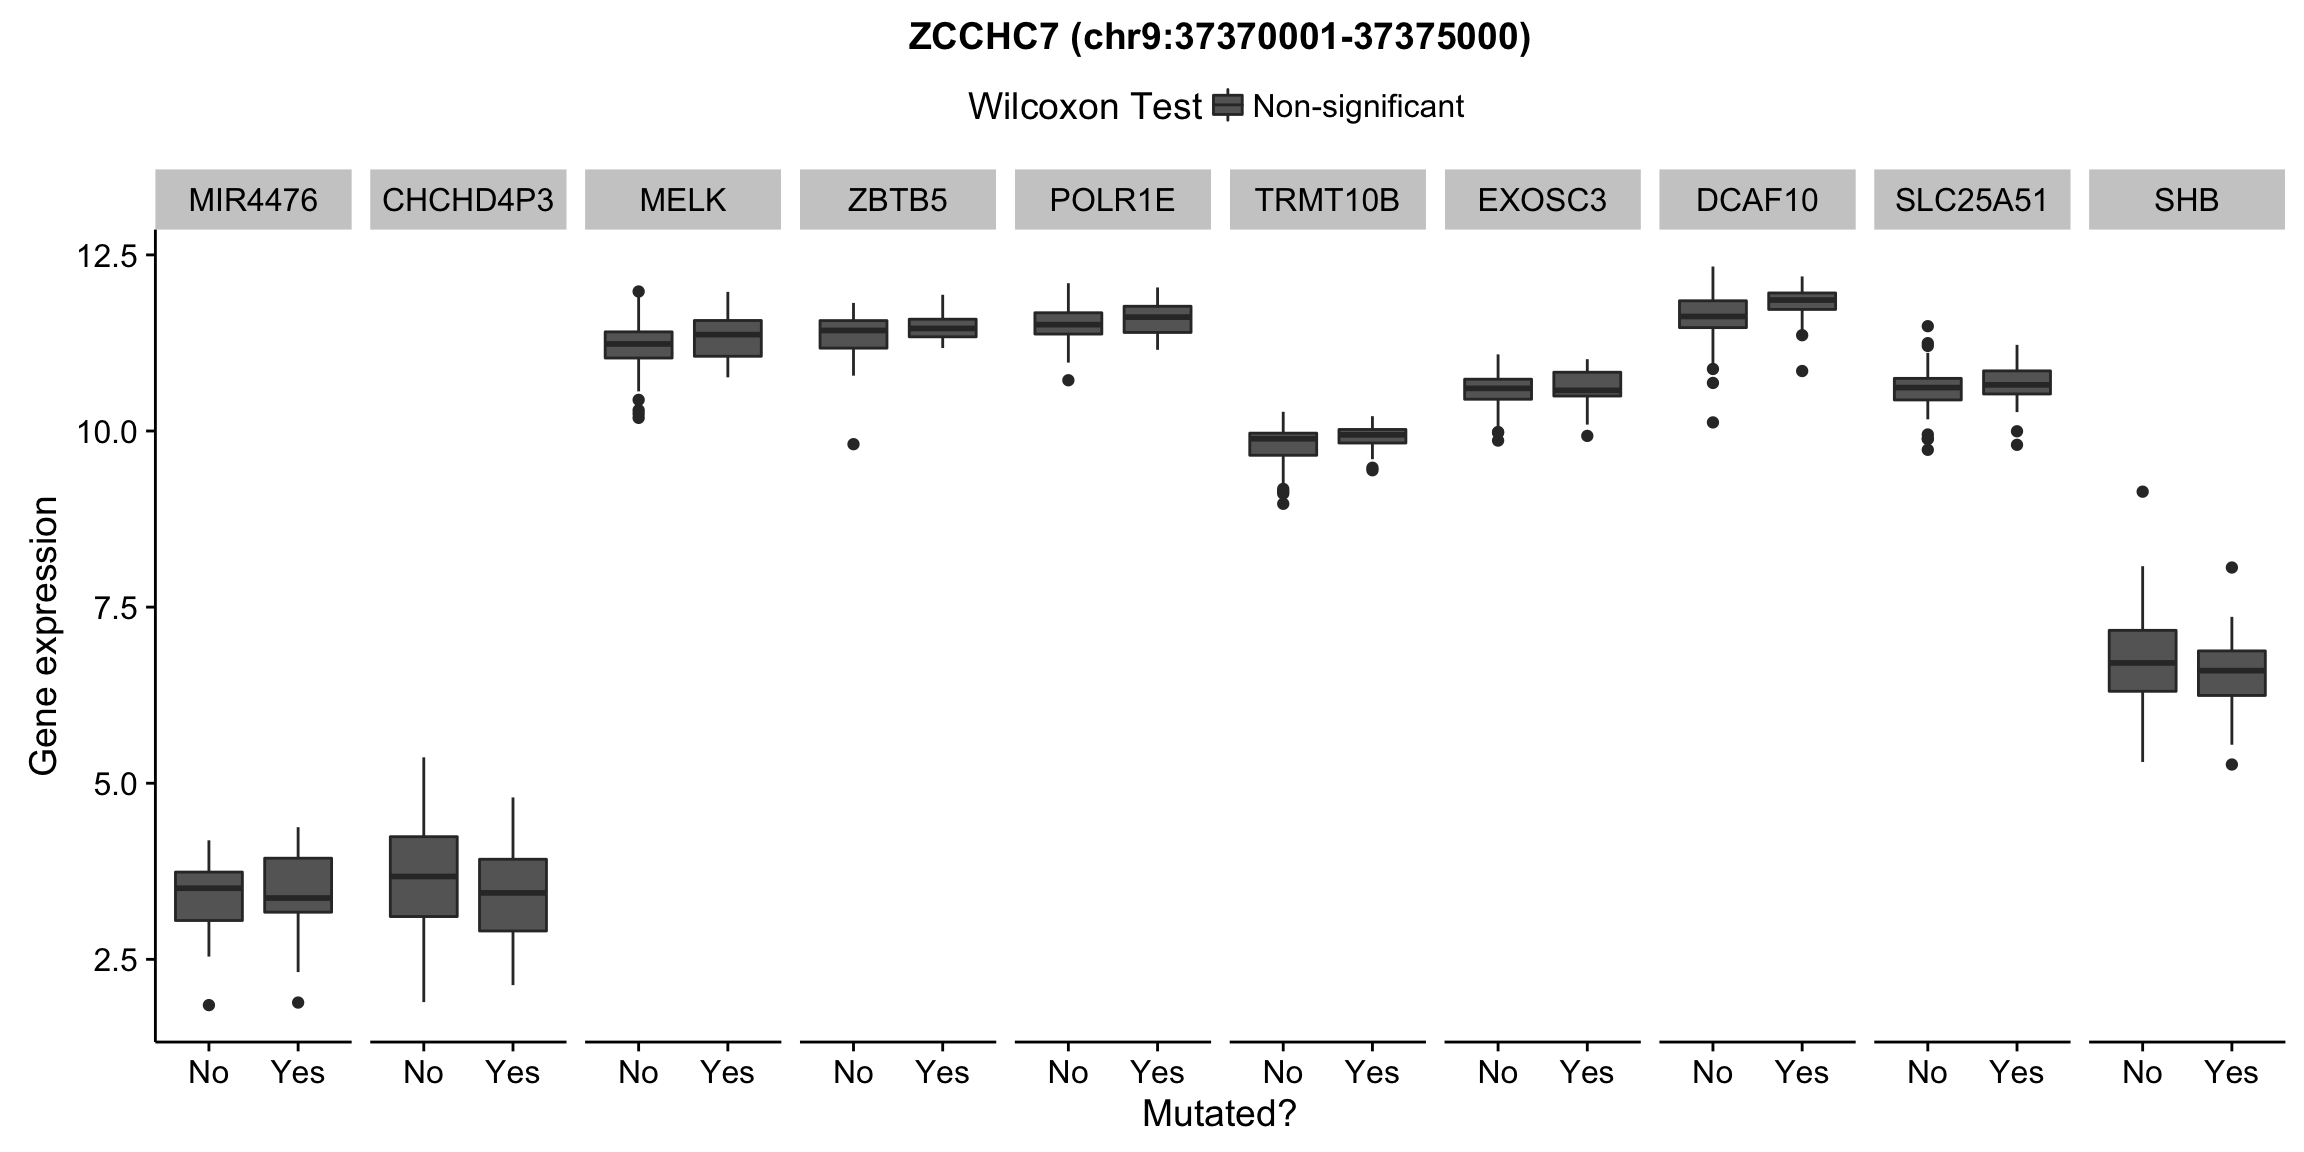
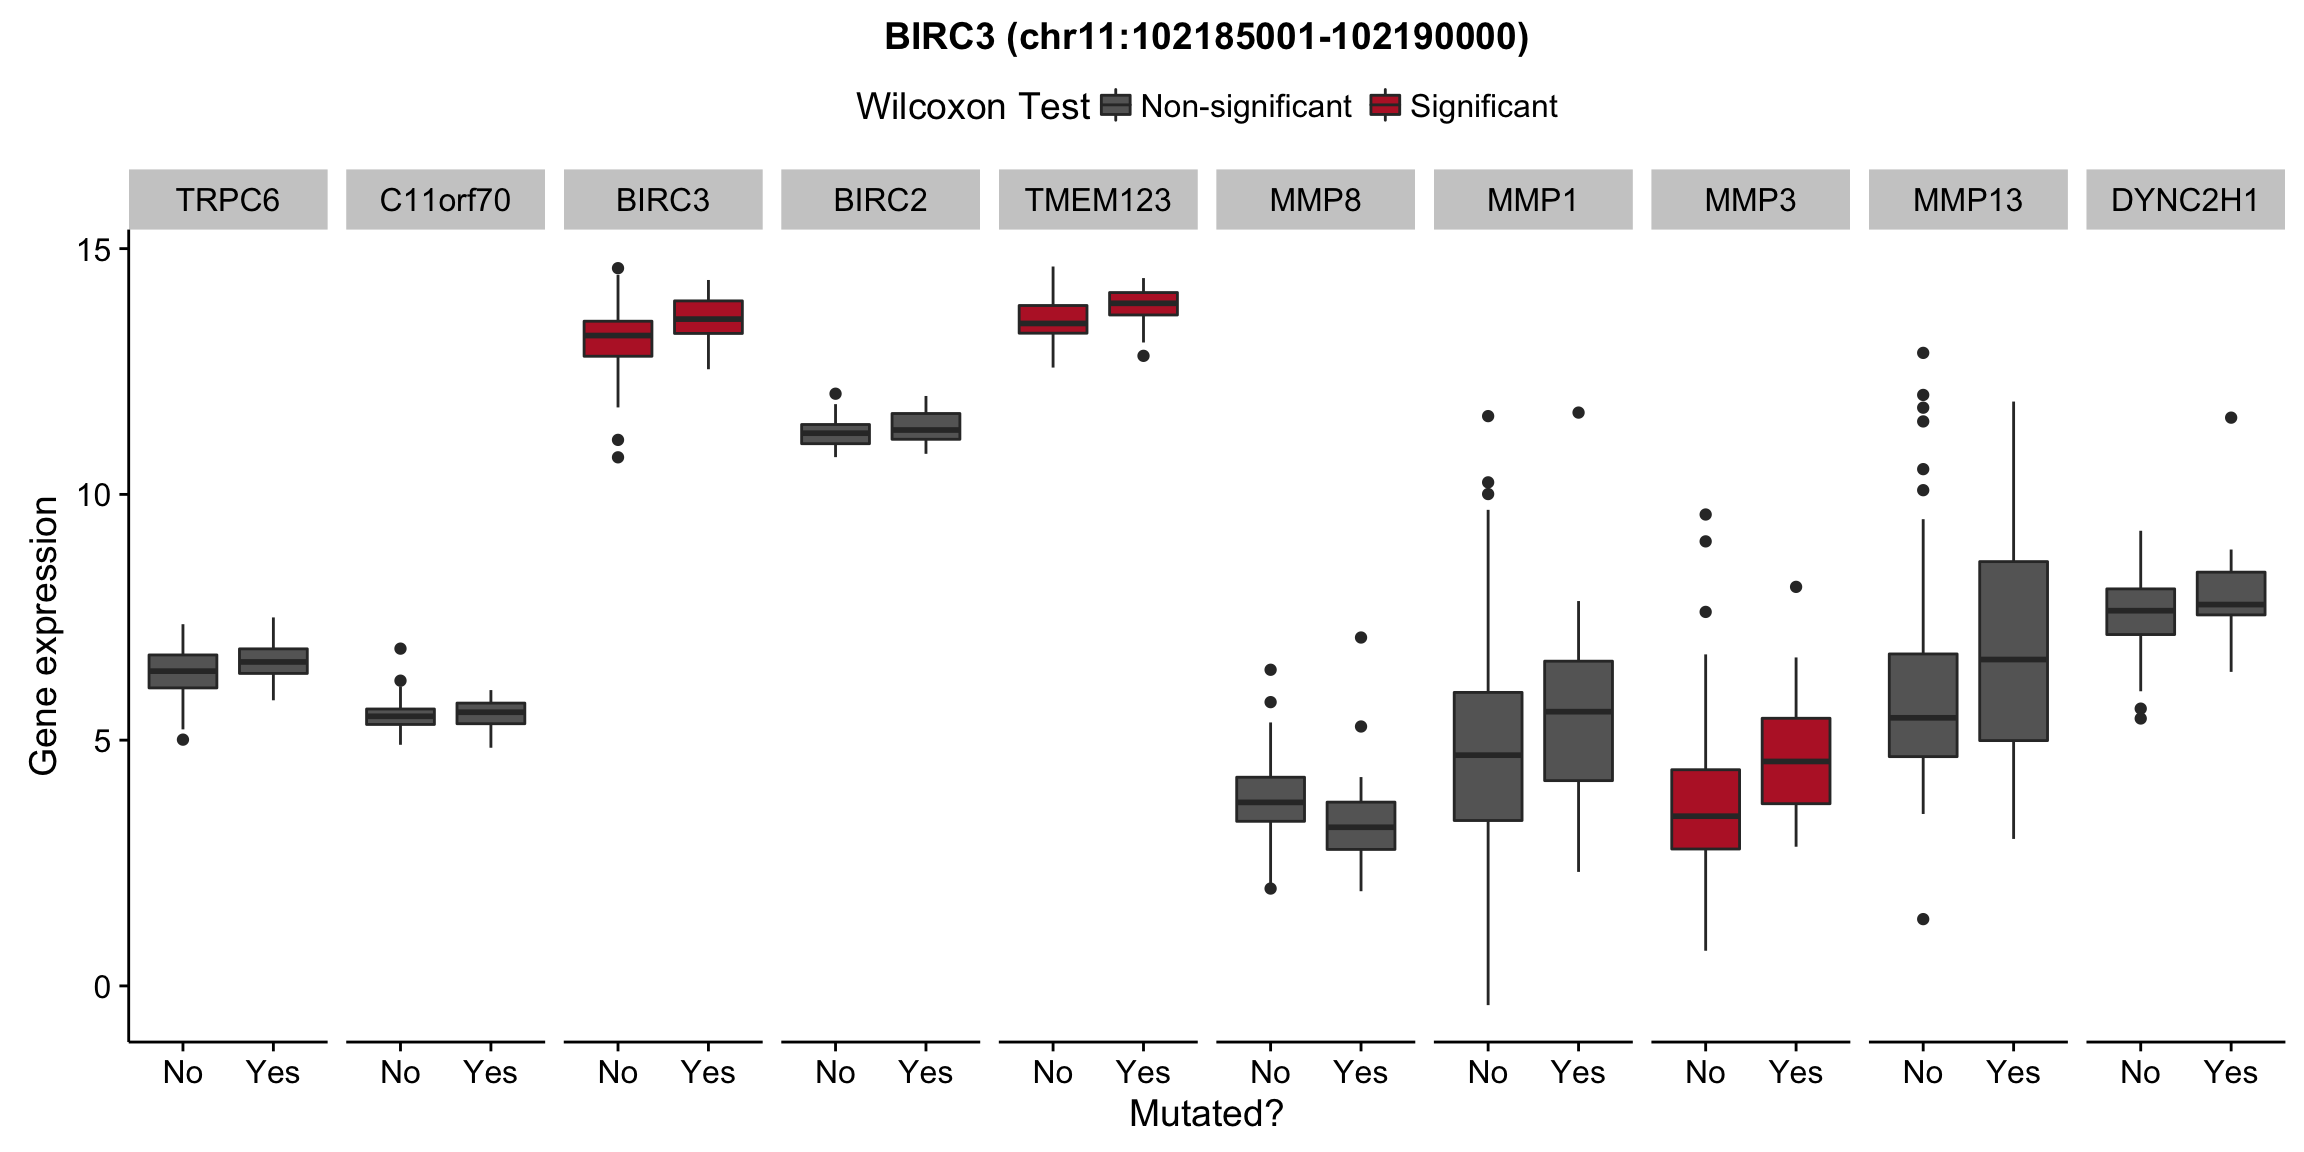
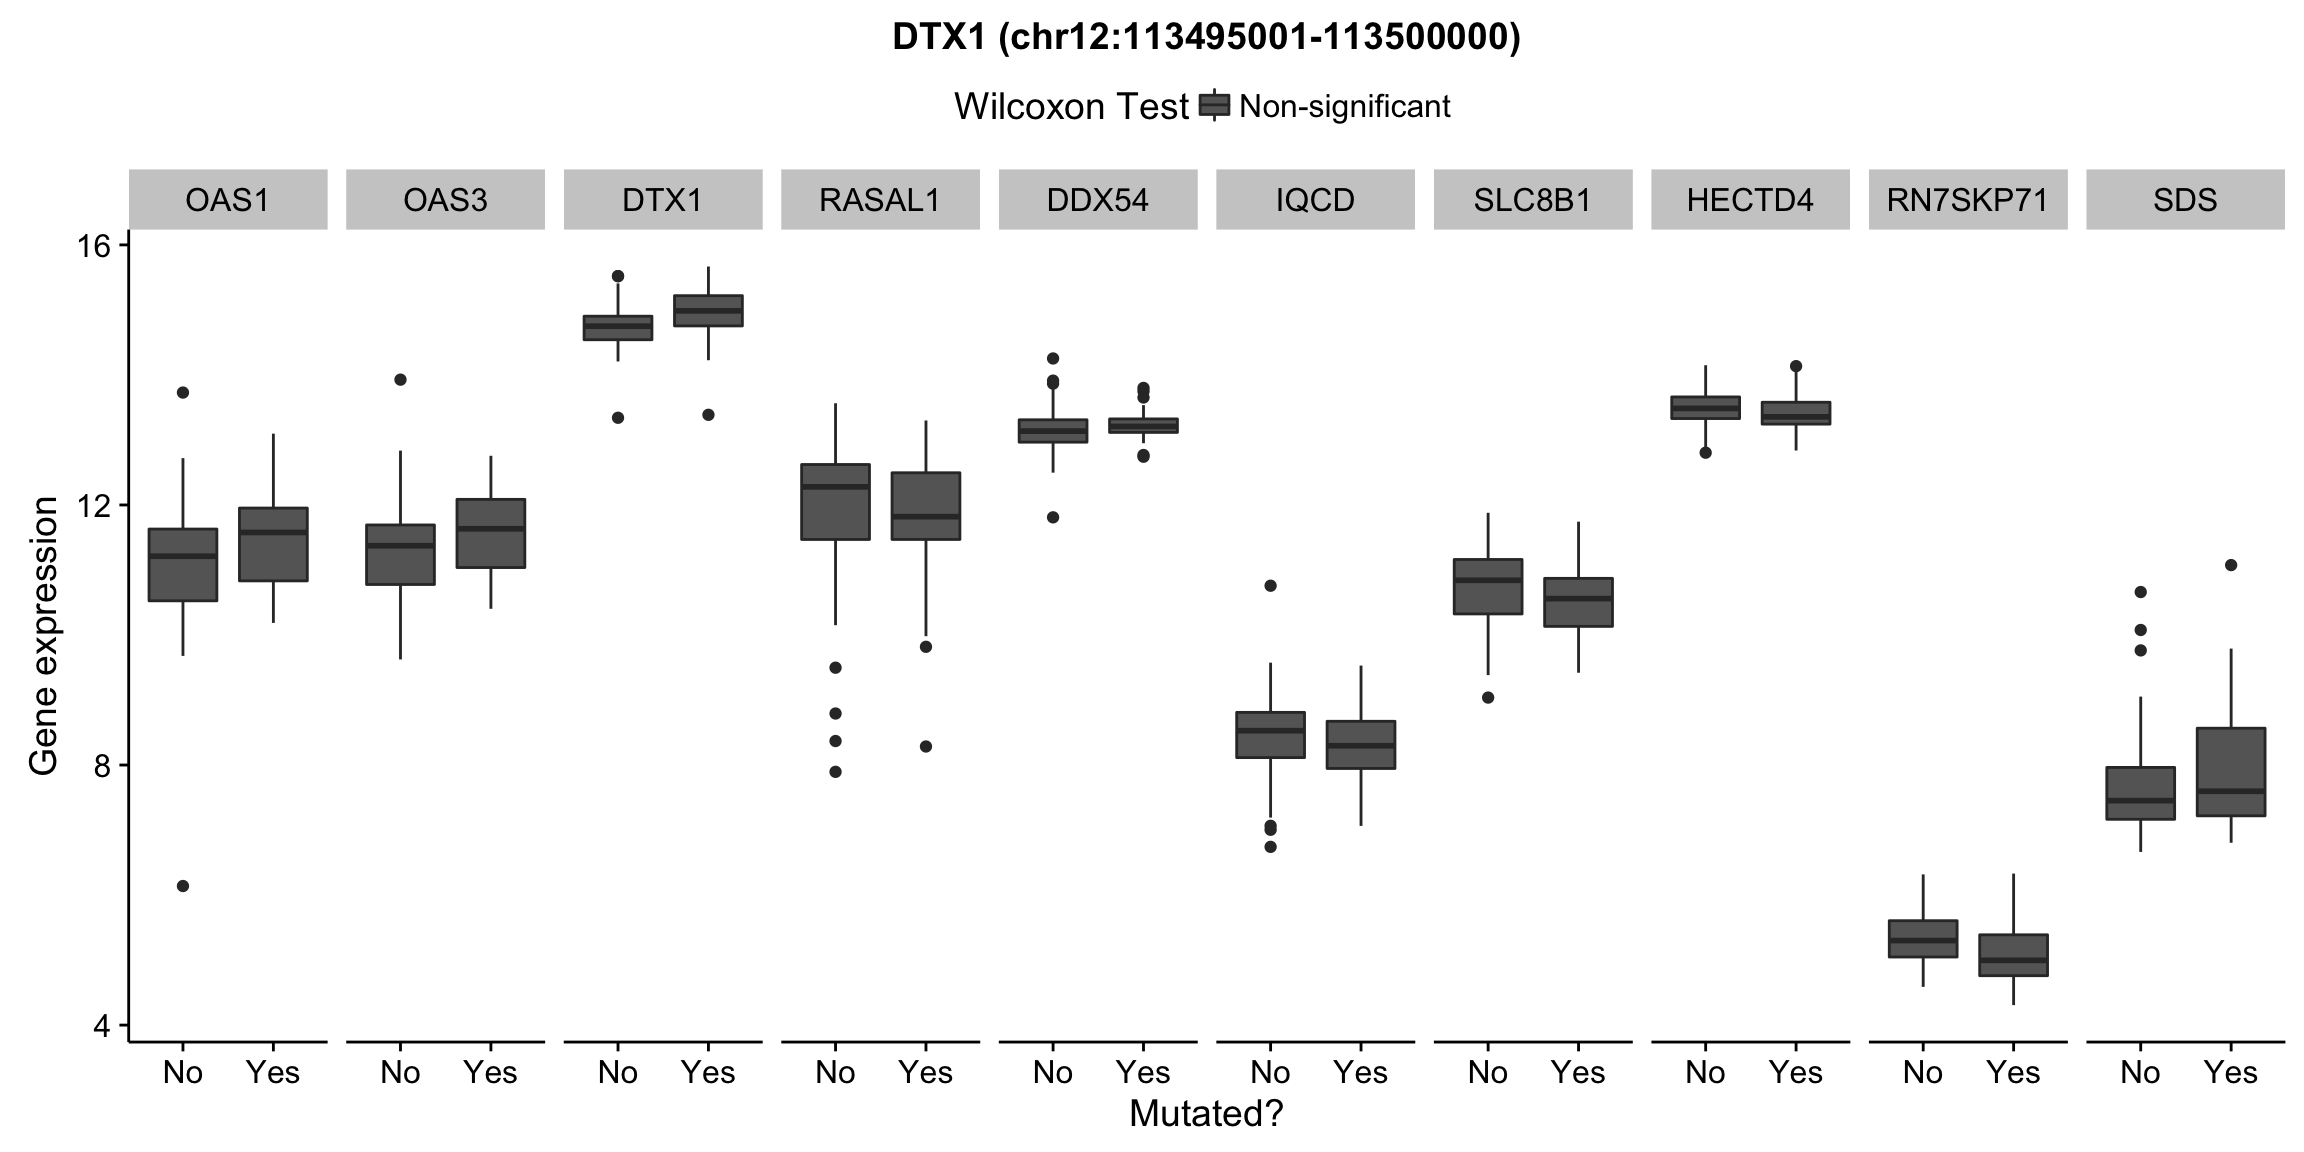
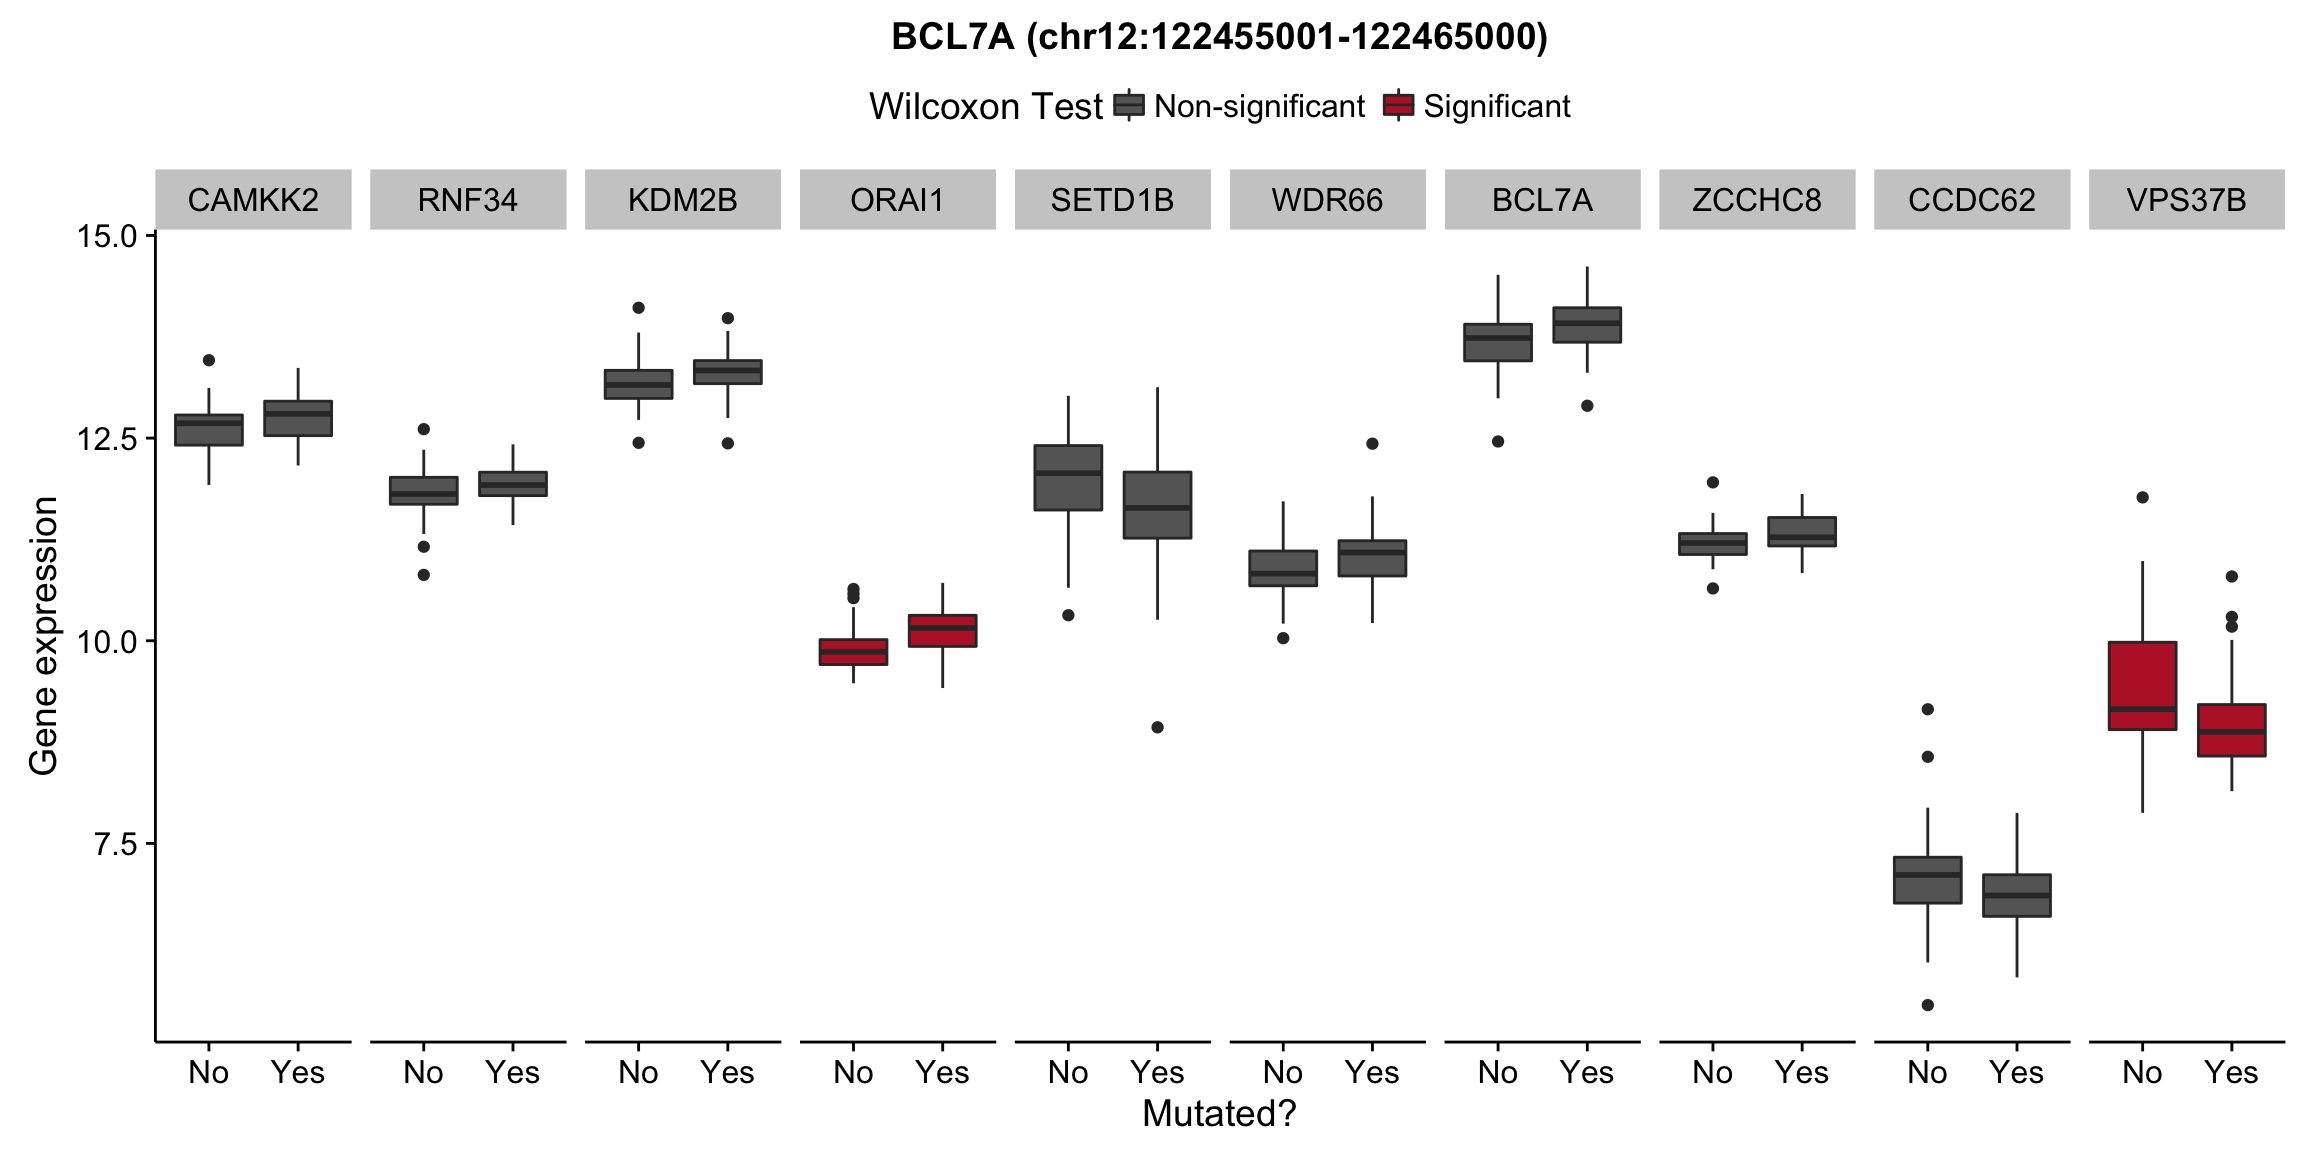
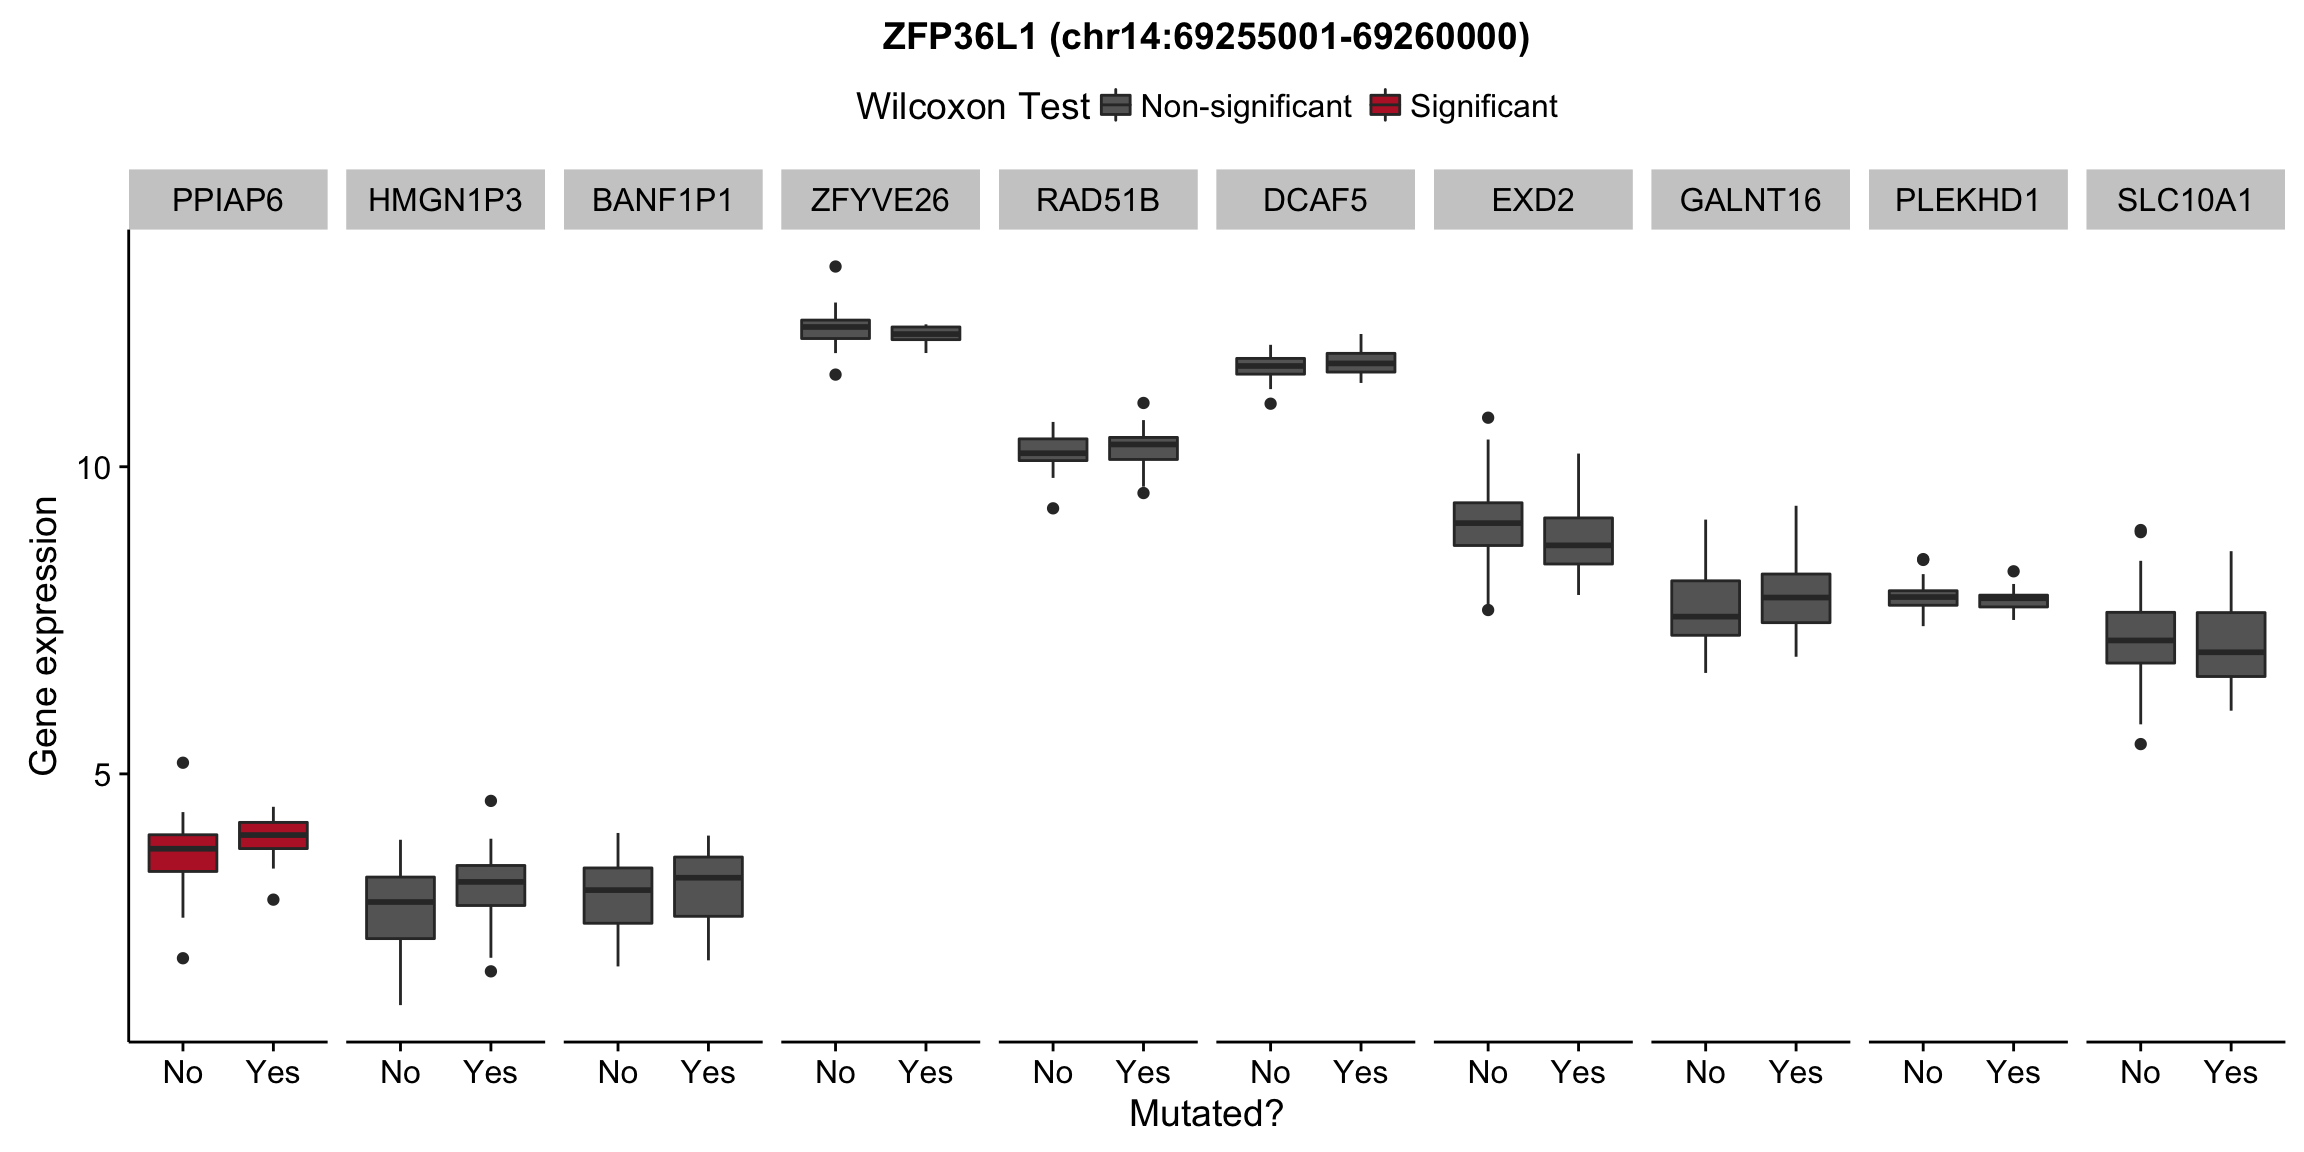
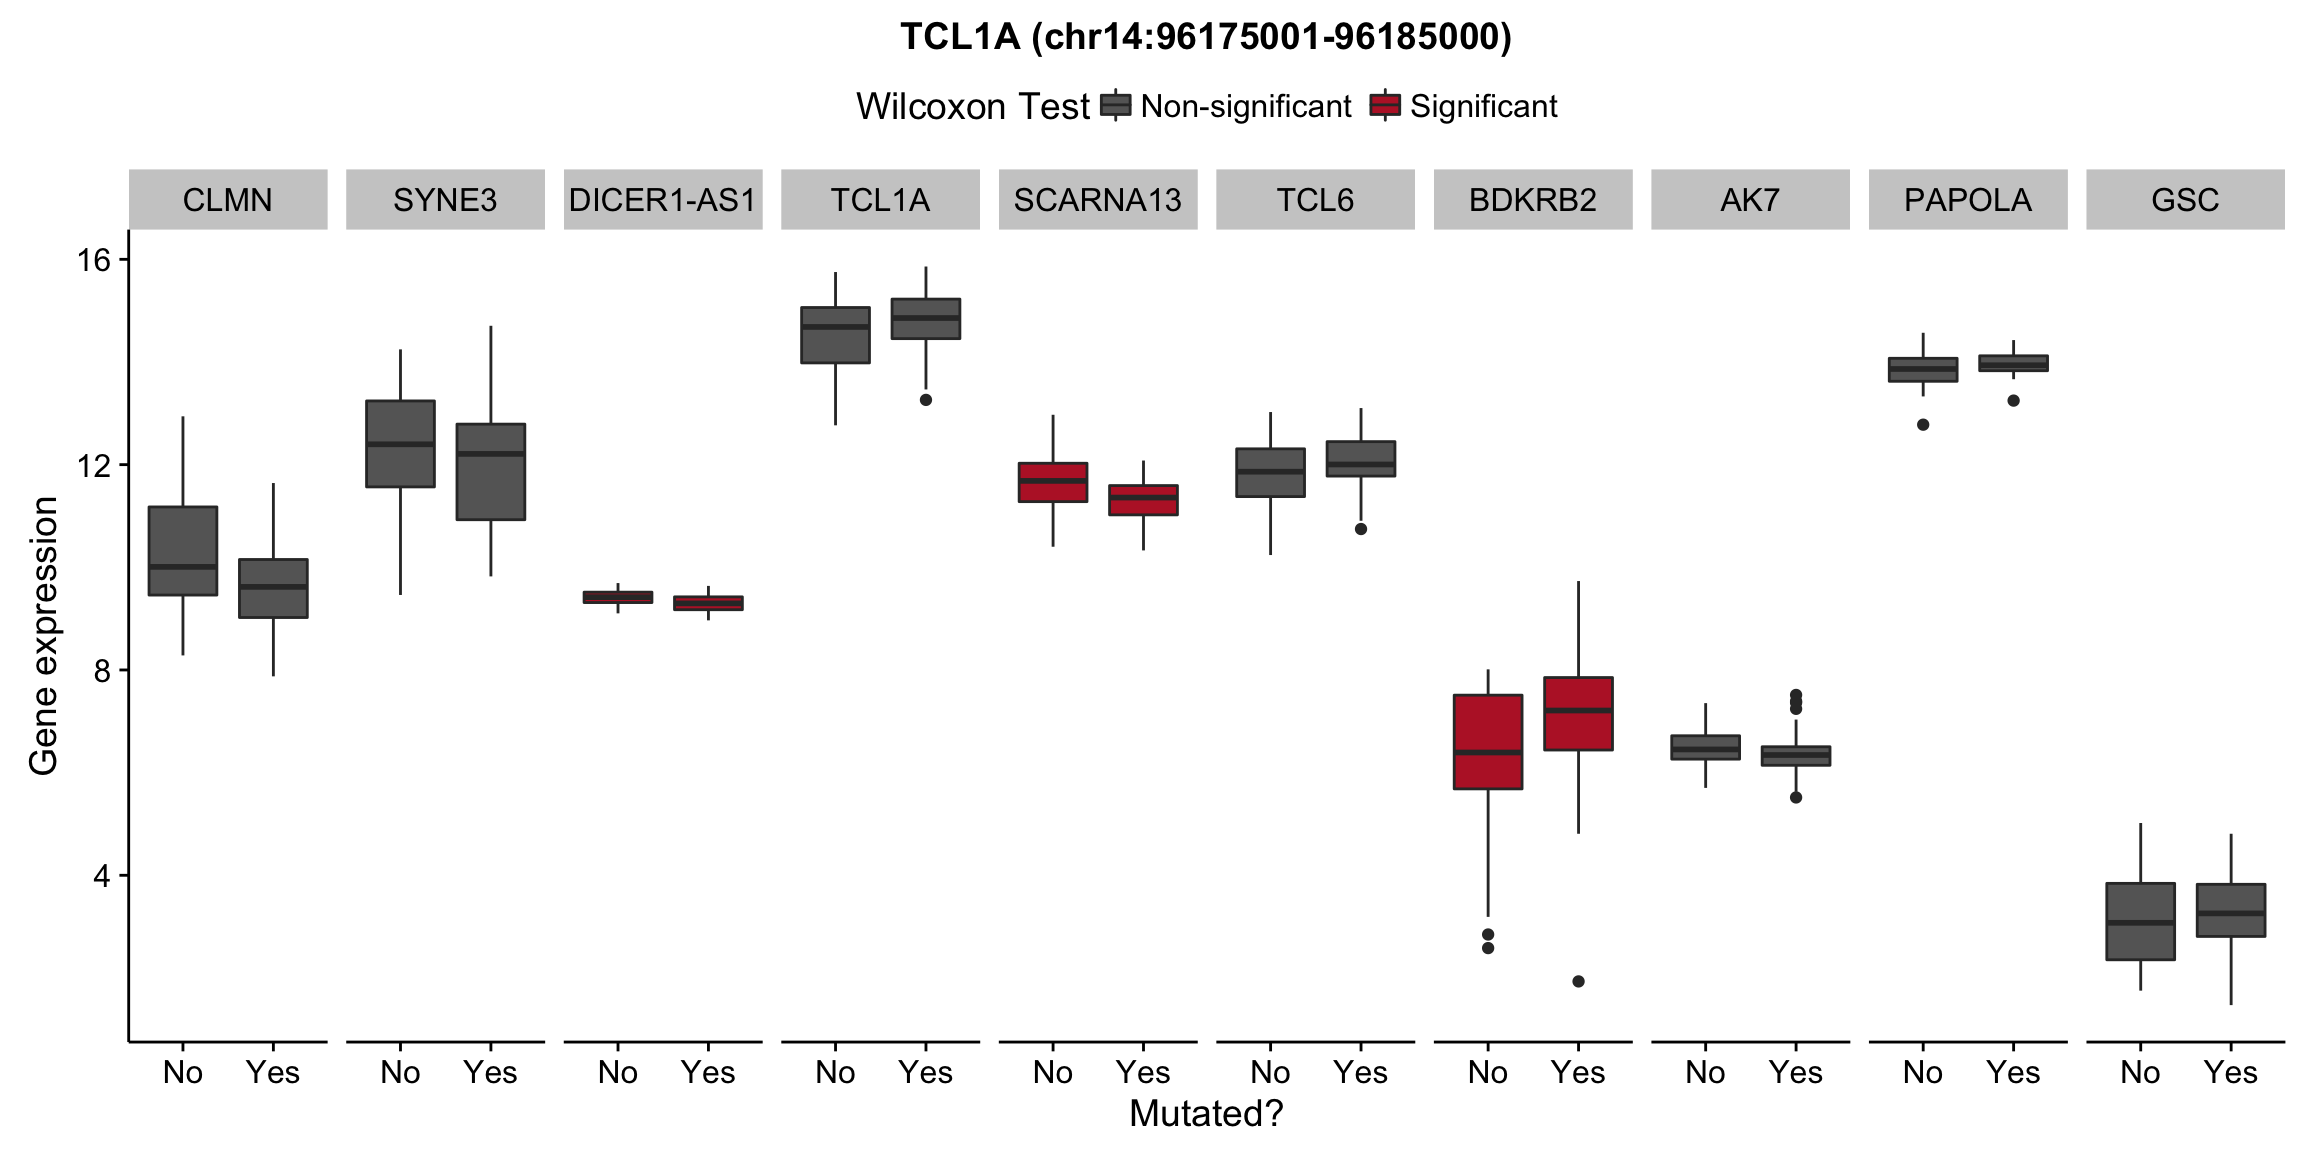
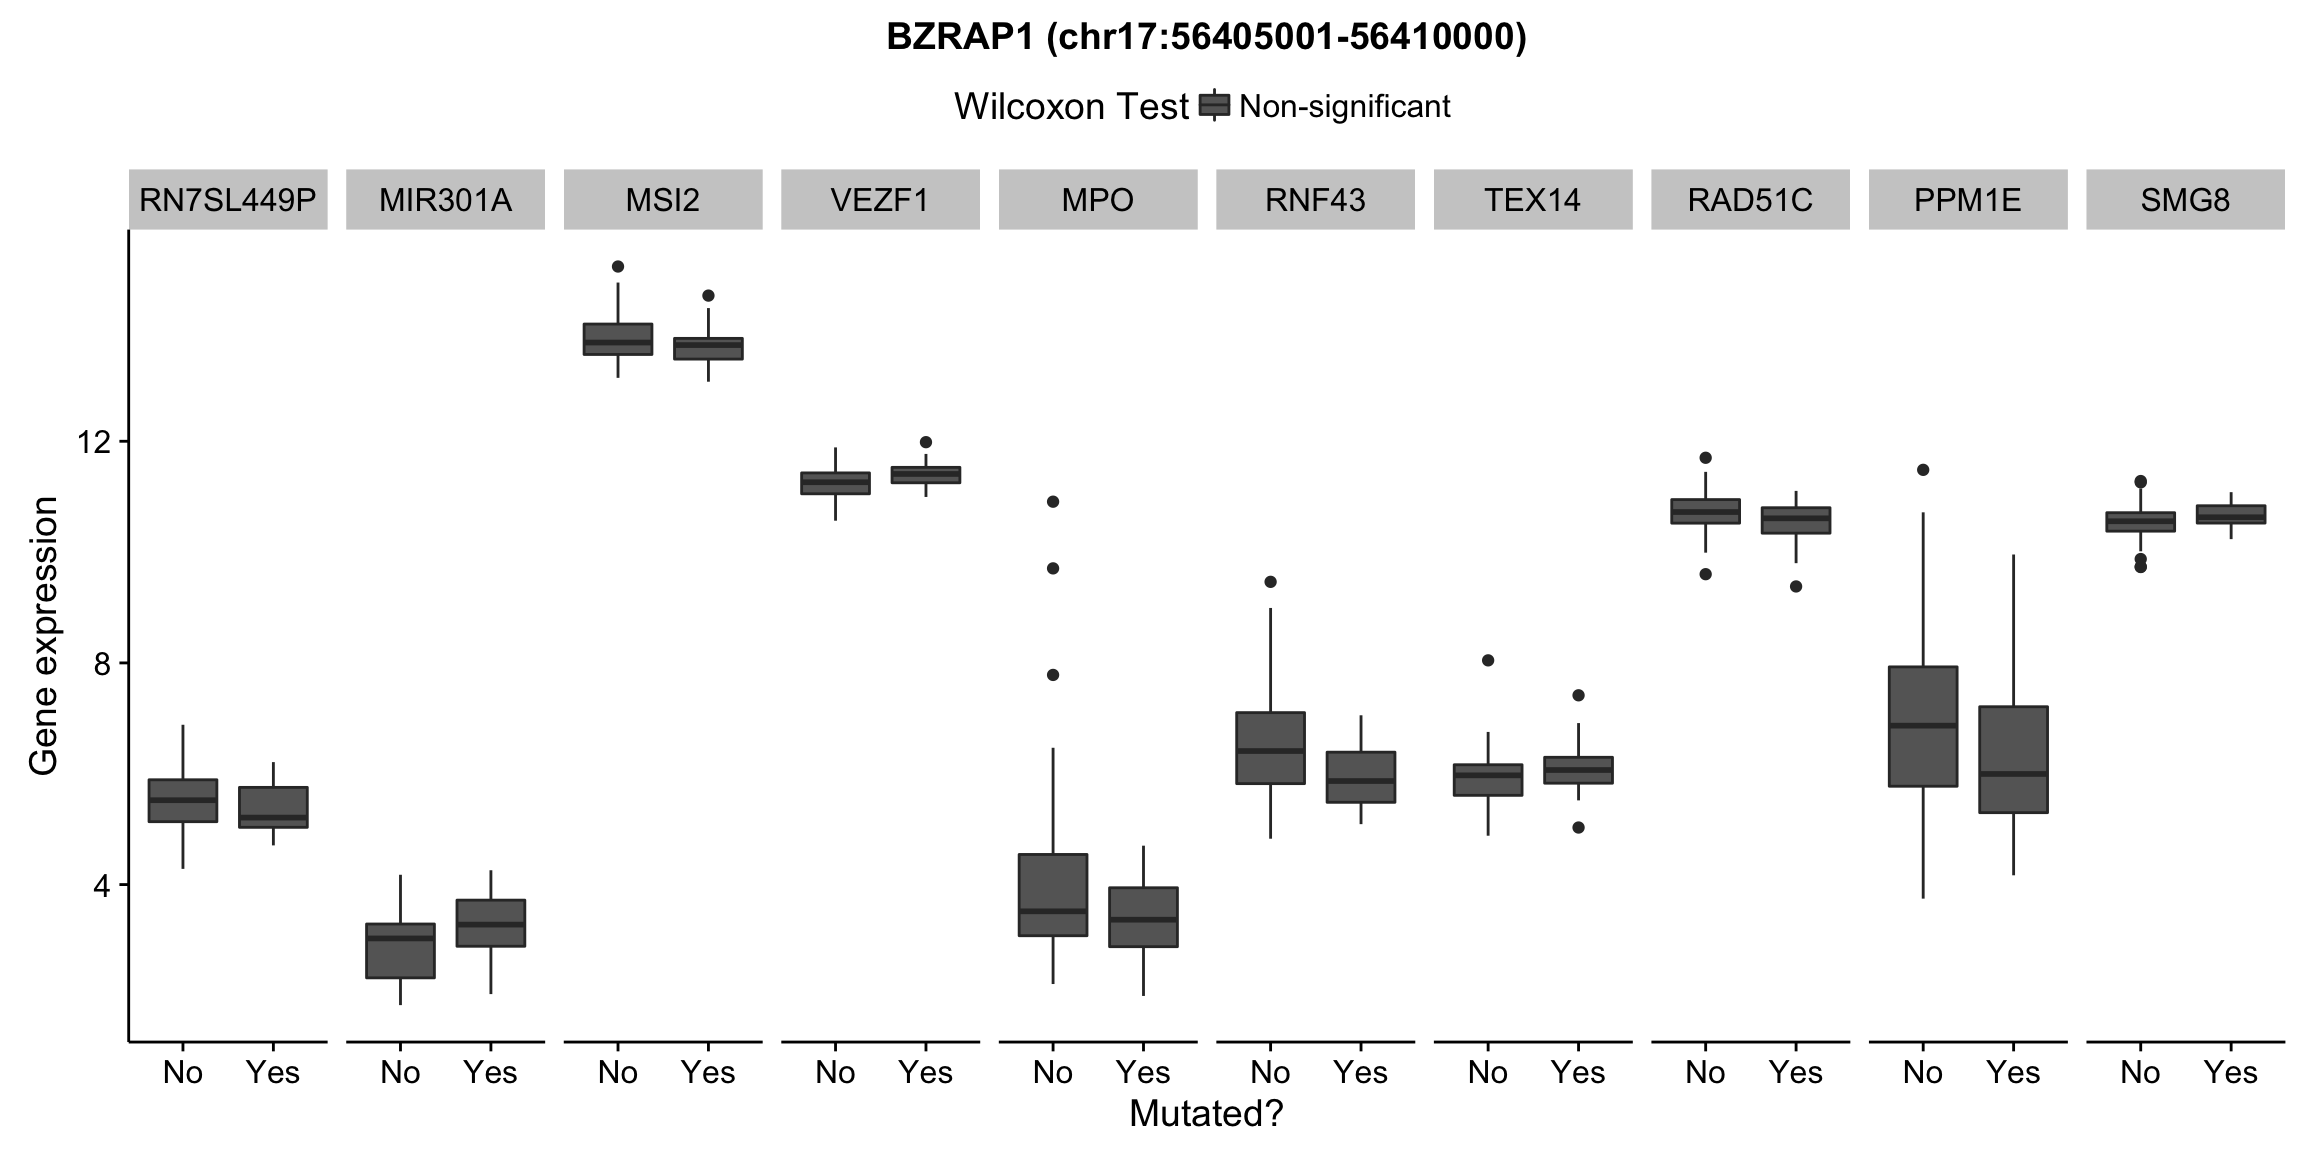
plot_nearby_gene_expr <- function(expr, genes, locus, groups, dist = 1e6, ntop = 10, title = NA) {
  hits <- findOverlaps(genes, locus + dist)
  nearby_genes <- genes[queryHits(hits)]$symbol
  nearby_genes <- nearby_genes[nearby_genes %in% rownames(expr)]
  expr_df <-
    expr[nearby_genes,, drop = FALSE] %>%
    t() %>%
    as.data.frame() %>%
    rownames_to_column("patient") %>%
    bind_cols(tibble(status = groups[colnames(expr)])) %>%
    drop_na() %>%
    gather(gene, expr, -patient, -status) %>%
    mutate(gene = fct_relevel(gene, nearby_genes)) %>%
    group_by(gene) %>%
    mutate(
      pval = wilcox.test(expr[status], expr[!status])$p.value,
      qval = p.adjust(pval, "BH"),
      signif = qval < 0.01) %>%
    ungroup()
  top_genes <-
    expr_df %>%
    dplyr::select(gene, qval) %>%
    distinct() %>%
    top_n(10, -qval) %$%
    gene
  expr_df %>%
    select(patient, status, gene, expr, signif) %>%
    mutate(status = ifelse(status, "Yes", "No")) %>%
    filter(gene %in% top_genes) %>%
    ggplot(aes(x = status, y = expr, group = status, fill = signif)) +
    geom_boxplot() +
    facet_grid(~ gene, scales = "free_x") +
    scale_fill_manual(values = c(`FALSE` = "#666666", `TRUE` = "#ba2331"),
                      labels = c("Non-significant", "Significant")) +
    ggtitle(title) +
    theme(legend.position = "top") +
    labs(x = "Mutated?", y = "Gene expression", fill = "Wilcoxon Test")
}

hits <- mut_counts_df %>%
  filter(signif) %>%
  makeGRangesFromDataFrame(keep.extra.columns = TRUE) %>%
  reduce()

plot_gene_expr_near_mutations <- function(expr, genes, hits, maf_grl,
                                          dist = 1e6, ntop = 10) {
  get_groups <- function(locus) {
    map_int(as.list(maf_grl), ~countOverlaps(locus, .x)) %>%
    { . > 0 } %>% {
    patient_ids <- ifelse(grepl("^BL", names(.)),
                          get_patient_id(names(.)),
                          get_icgc_donor[names(.)])
    setNames(., patient_ids)}
  }

  get_nearest_gene <- function(x, genes_gr) {
    gene_idx <- GenomicRanges::nearest(x, genes_gr)
    genes_gr[gene_idx]$symbol
  }

  get_hit_name <- function(x, genes_gr) {
    nearest_gene <- get_nearest_gene(x, genes_gr)
    x <- as.data.frame(x)
    paste0(nearest_gene, " (", x$seqnames, ":", x$start, "-", x$end, ")")
  }

  map(as.list(hits), get_groups) %>%
    map2(as.list(hits), ., ~ plot_nearby_gene_expr(assay(salmon$clean$cvst), genes_gr, .x, .y,
                                                   title = get_hit_name(.x, genes_gr))) %>%
    gridExtra::grid.arrange(grobs = .)
}

for (hit in as.list(hits)) {
  plot_gene_expr_near_mutations(assay(salmon$clean$cvst), genes_gr, hit, maf_grl)
}