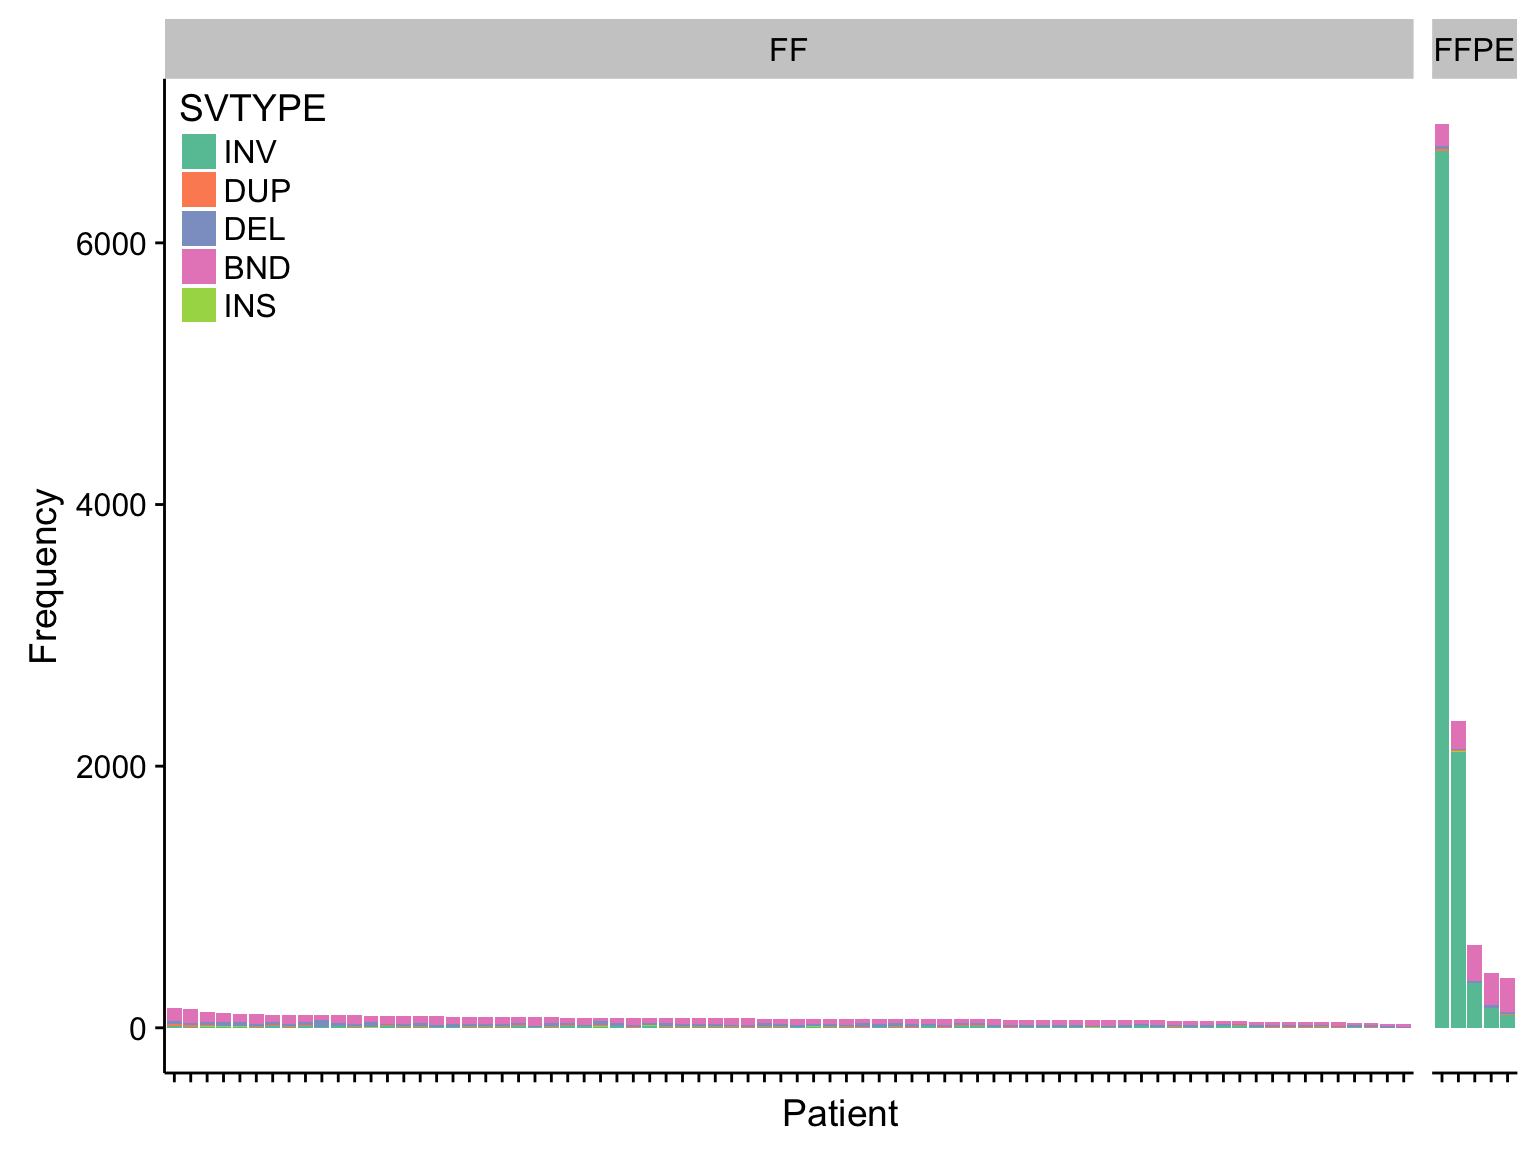
SV Burden
barplot_manta_raw_freq <-
  manta_raw %>%
  count(patient, ff_or_ffpe, SVTYPE) %>%
  ungroup() %>%
  mutate(patient = fct_reorder(patient, -n, sum)) %>%
  ggplot(aes(patient, n, fill = SVTYPE)) +
  geom_col() +
  scale_x_discrete(labels = NULL) +
  scale_fill_manual(values = c("#66C2A5", "#FC8D62", "#8DA0CB", "#E78AC3", "#A6D854"),
                    limits = c("INV", "DUP", "DEL", "BND", "INS")) +
  facet_grid(~ ff_or_ffpe, scales = "free_x", space = "free_x") +
  rotate_x_text() +
  place_legend(c(0, 1)) +
  labs(x = "Patient", y = "Frequency")

barplot_manta_raw_freq
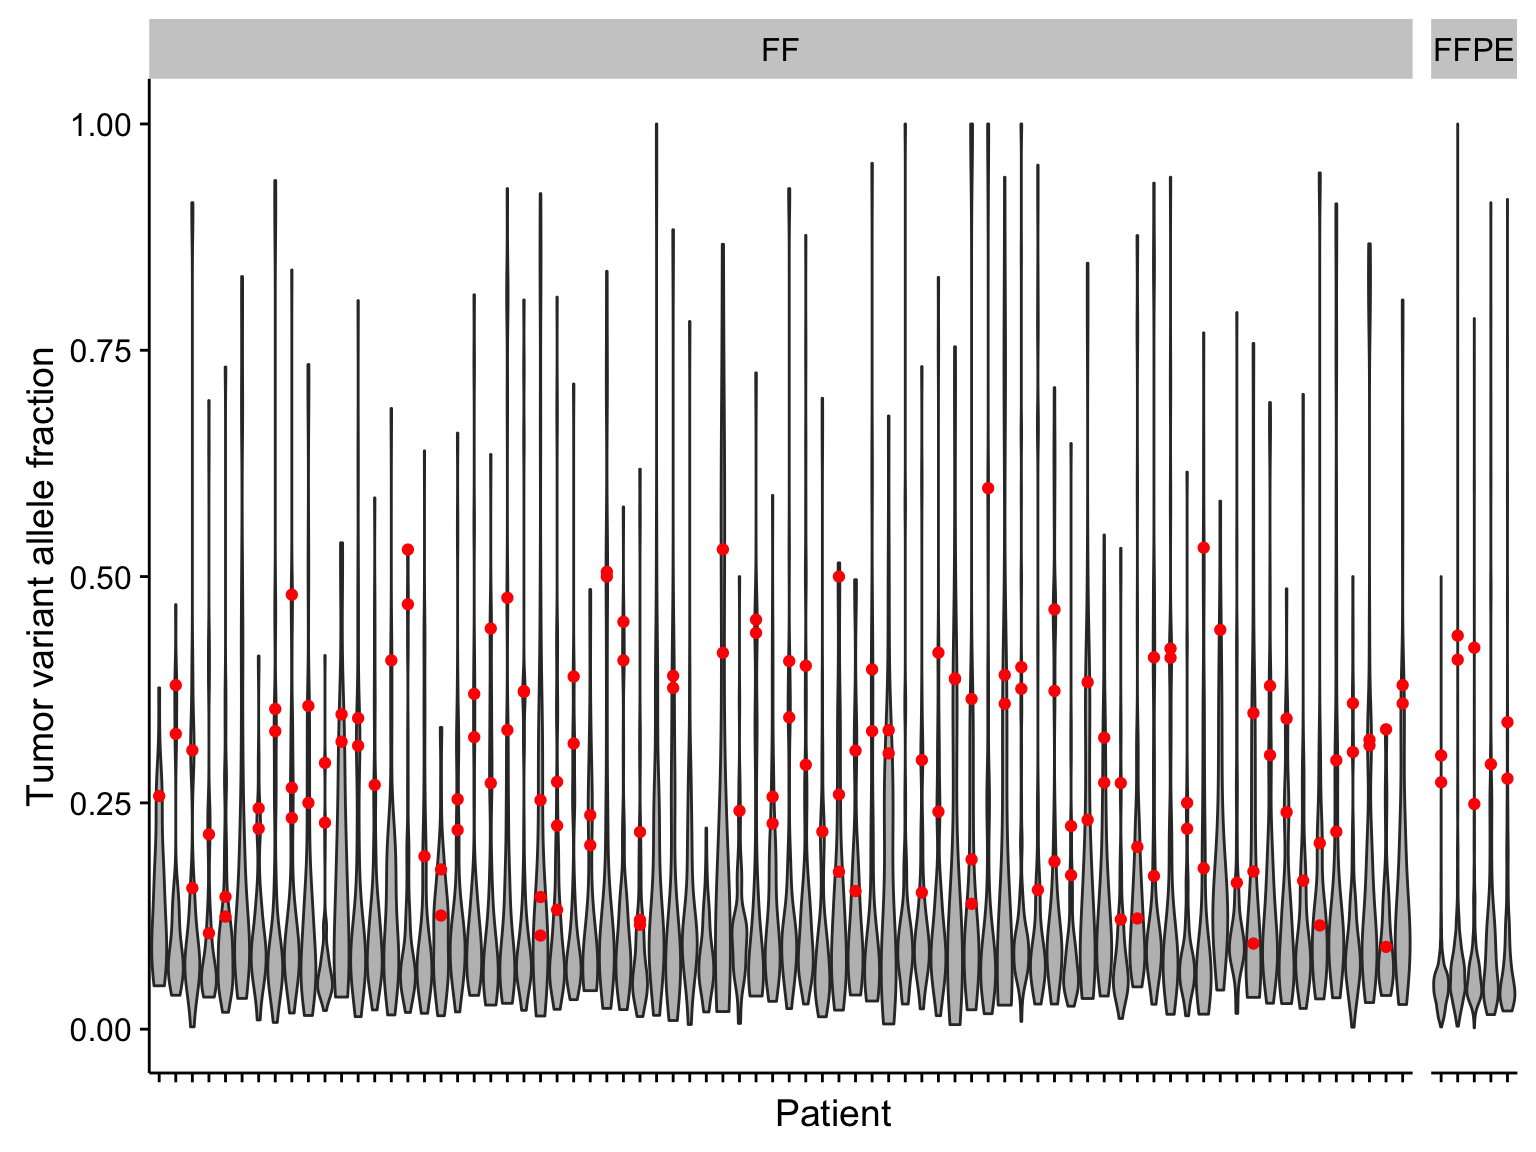
violinplot_manta_raw_vaf <-
  manta_raw %>%
  mutate(
    is_myc = (seqnames == "chr8" & start > 127300000 &
              start < 128300000 & grepl("chr(2|14|22)", ALT)),
    patient = fct_reorder(patient, -tc)) %>% {
  ggplot(., aes(patient, TVAF)) +
  geom_violin(fill = "grey", scale = "width") +
  geom_point(data = filter(., is_myc), colour = "red") +
  facet_grid(~ ff_or_ffpe, scales = "free_x", space = "free_x") +
  scale_x_discrete(labels = NULL) +
  rotate_x_text() +
  labs(x = "Patient", y = "Tumor variant allele fraction")}

violinplot_manta_raw_vaf
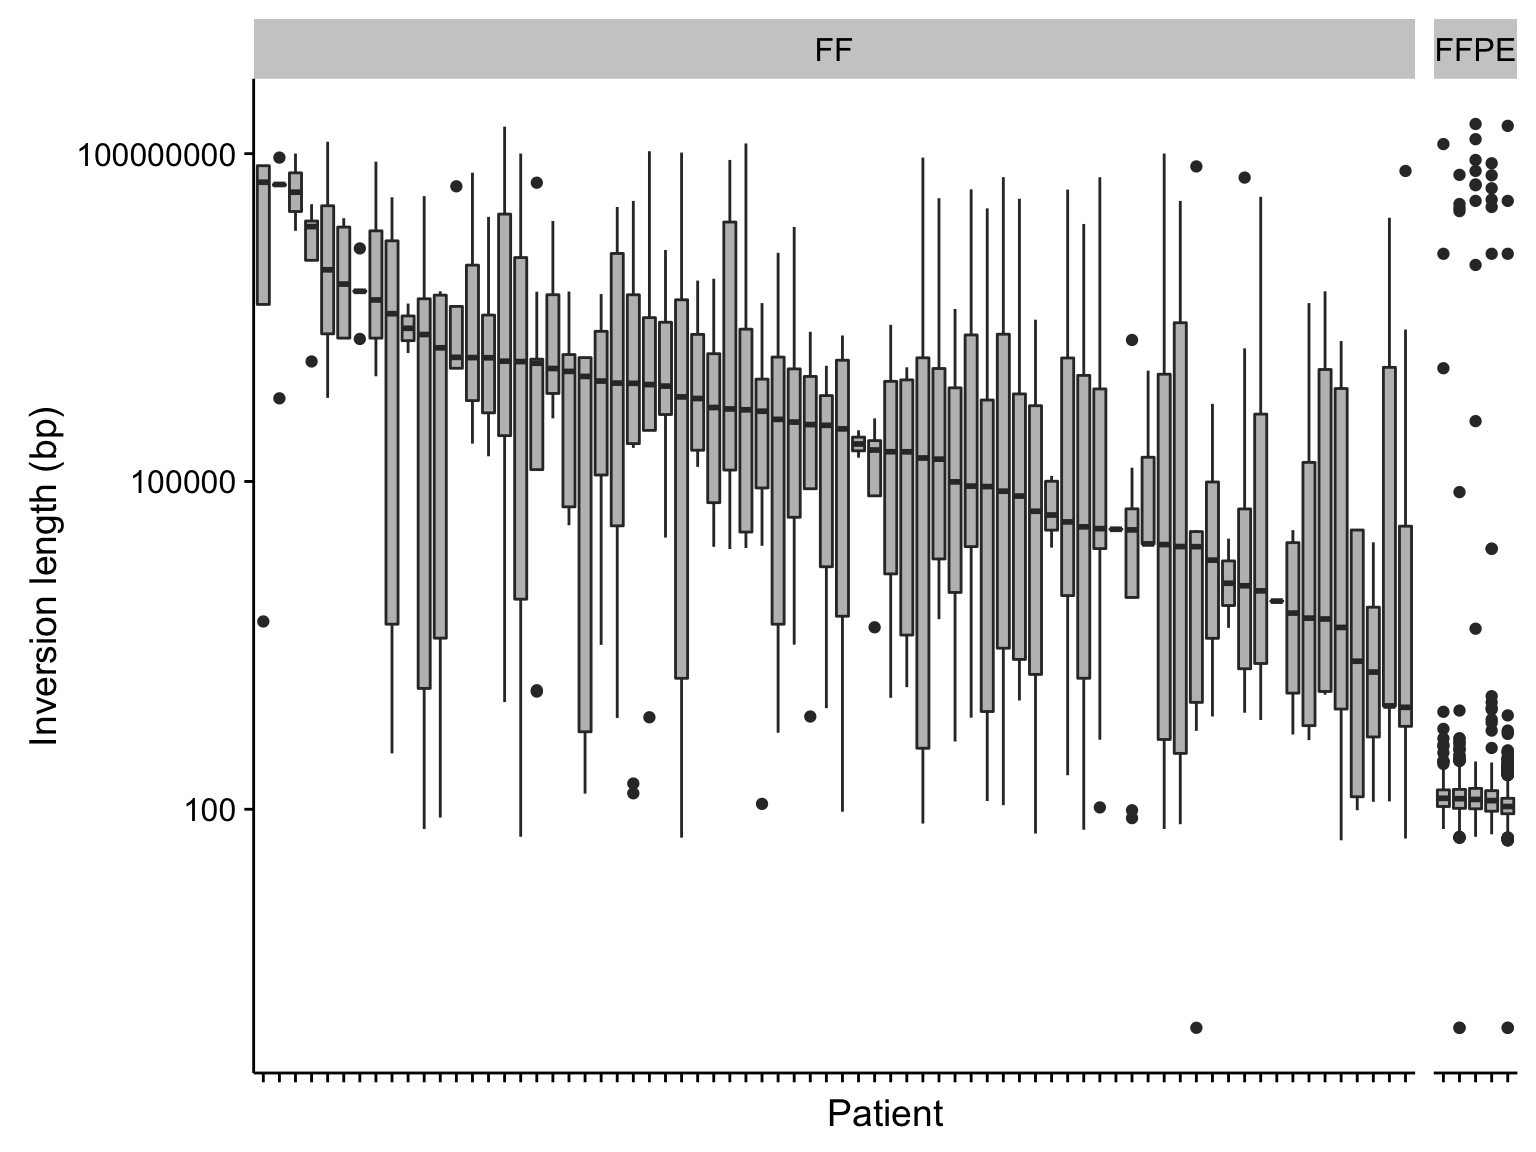
boxplot_manta_raw_inv_svlen <-
  manta_raw %>%
  filter(SVTYPE == "INV") %>%
  mutate(
    SVLEN = abs(SVLEN),
    patient = fct_reorder(patient, SVLEN, function(x) -median(log10(x)))) %>%
  ggplot(aes(patient, SVLEN)) +
  geom_boxplot(fill = "grey") +
  facet_grid(~ ff_or_ffpe, scales = "free_x", space = "free_x") +
  rotate_x_text() +
  scale_x_discrete(labels = NULL) +
  scale_y_log10() +
  labs(x = "Patient", y = "Inversion length (bp)")

boxplot_manta_raw_inv_svlen
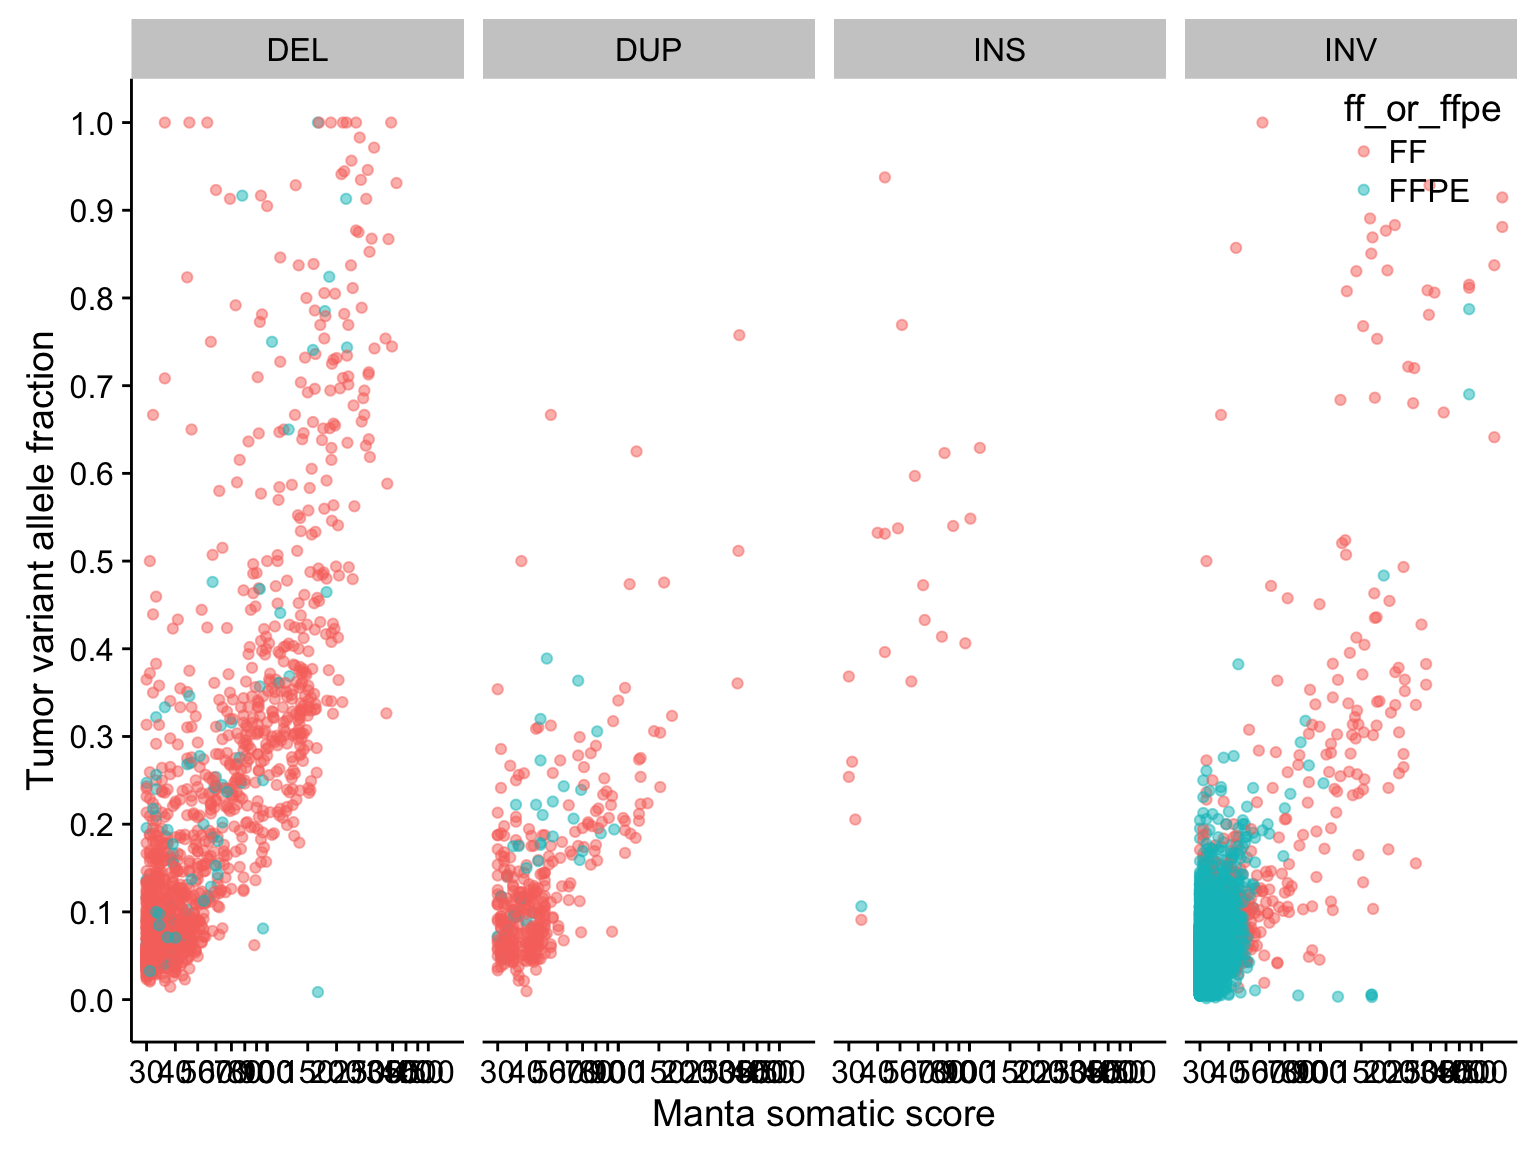
scatterplot_manta_raw_inv_somaticscore_tvaf <-
  manta_raw %>%
  filter(!is.na(SVLEN)) %>%
  mutate(SVLEN = abs(SVLEN)) %>%
  ggplot(aes(SOMATICSCORE, TVAF, colour = ff_or_ffpe)) +
  geom_point(alpha = 0.5) +
  scale_x_log10(breaks = c(seq(0, 100, 10), seq(100, 500, 50))) +
  scale_y_continuous(breaks = seq(0, 1, 0.1)) +
  facet_grid(~ SVTYPE) +
  place_legend(c(1,1)) +
  labs(x = "Manta somatic score", y = "Tumor variant allele fraction")

scatterplot_manta_raw_inv_somaticscore_tvaf
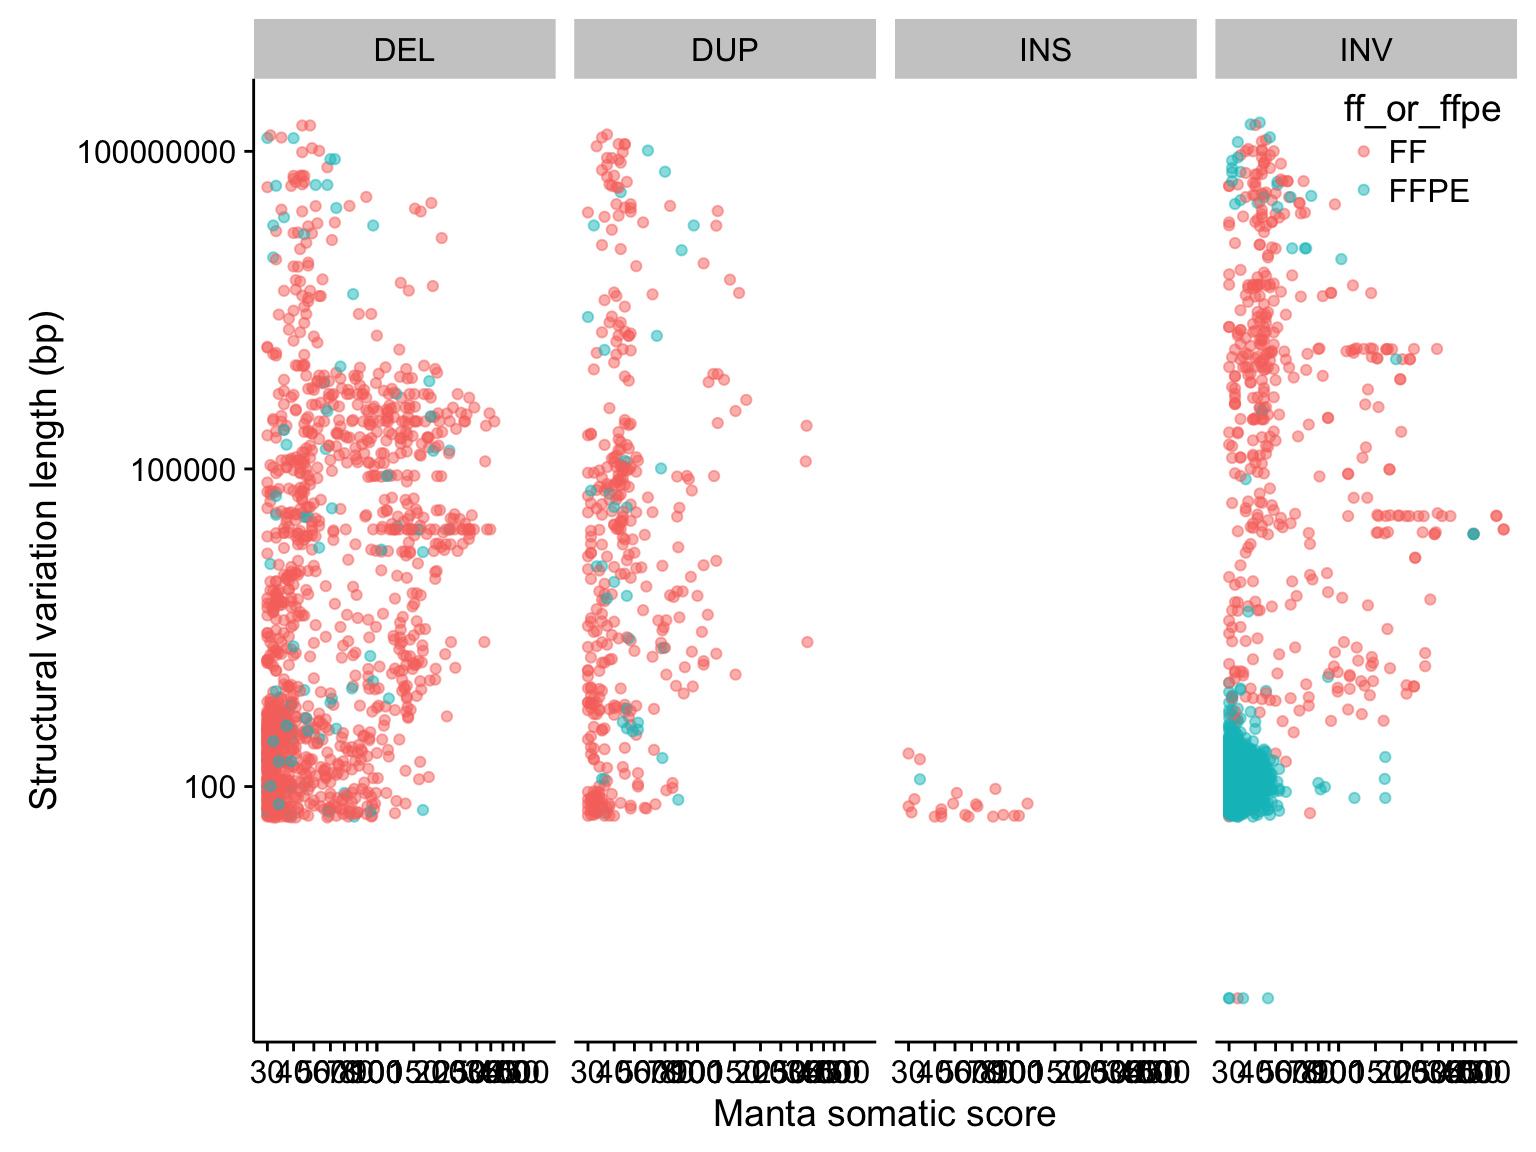
scatterplot_manta_raw_inv_somaticscore_svlen <-
  manta_raw %>%
  filter(!is.na(SVLEN)) %>%
  mutate(SVLEN = abs(SVLEN)) %>%
  ggplot(aes(SOMATICSCORE, SVLEN, colour = ff_or_ffpe)) +
  geom_point(alpha = 0.5) +
  scale_x_log10(breaks = c(seq(0, 100, 10), seq(100, 500, 50))) +
  scale_y_log10() +
  facet_grid(~ SVTYPE) +
  place_legend(c(1,1)) +
  labs(x = "Manta somatic score", y = "Structural variation length (bp)")

scatterplot_manta_raw_inv_somaticscore_svlen
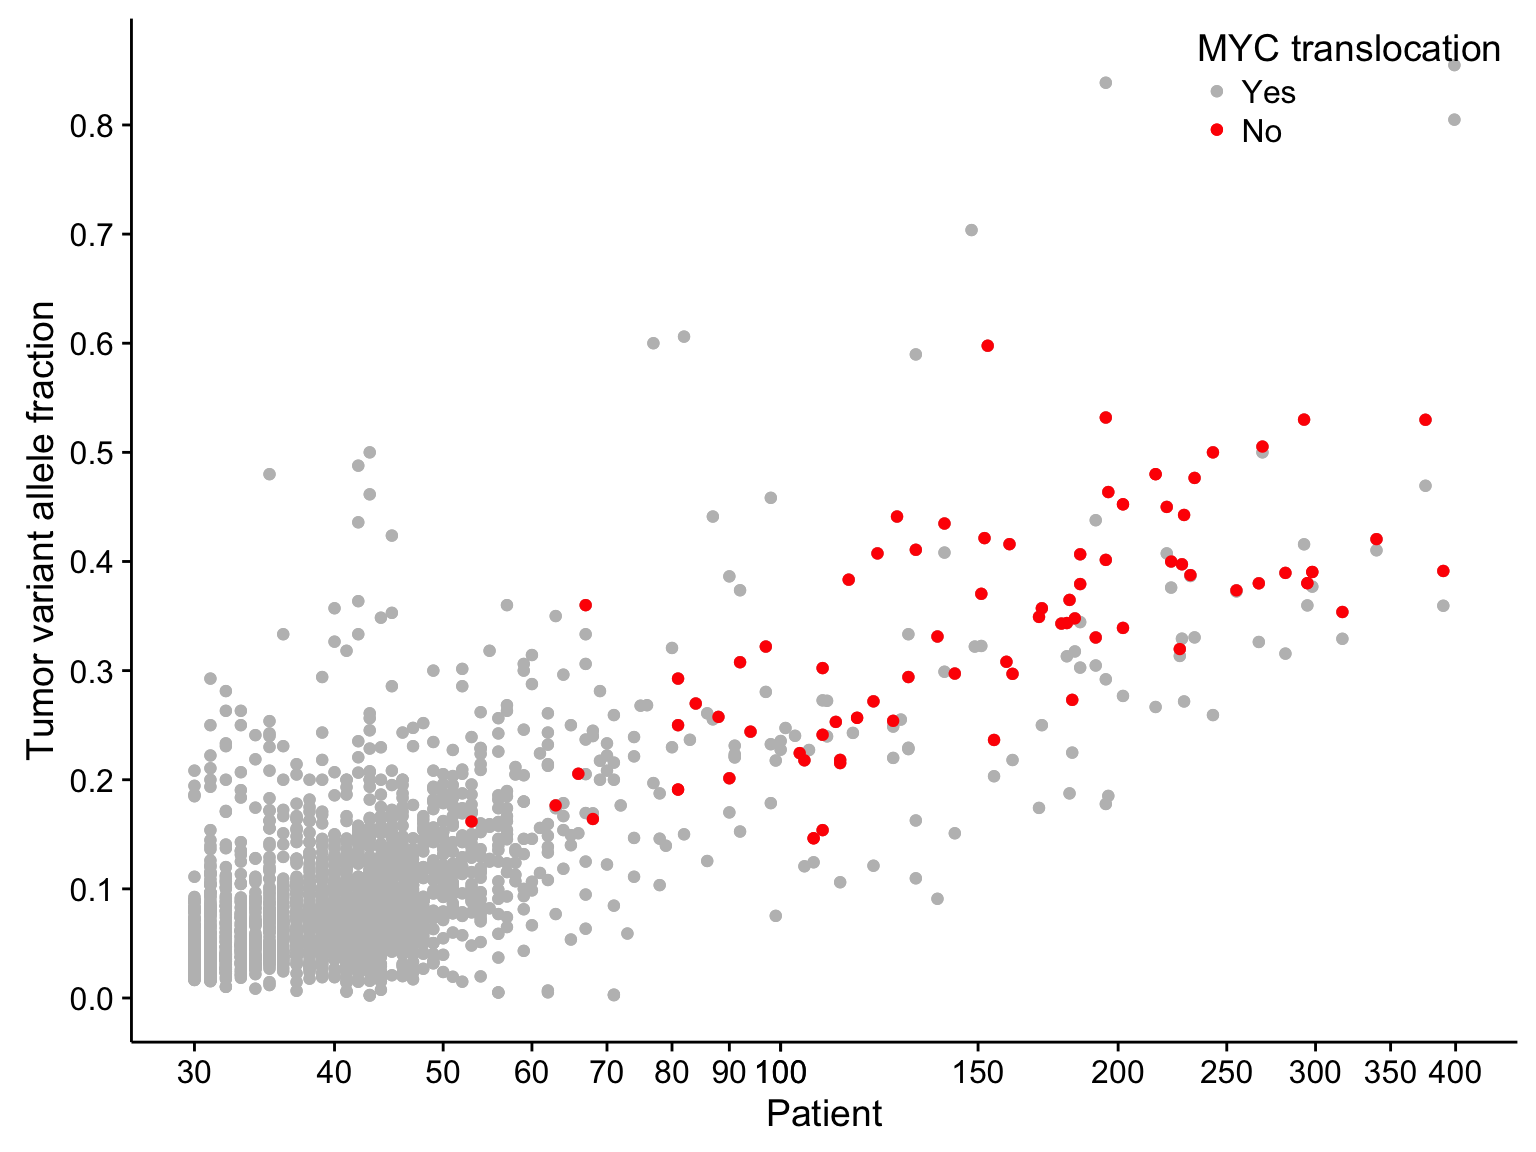
scatterplot_manta_raw_bnd_tvaf_somatic_score <-
  manta_raw %>%
  filter(SVTYPE == "BND") %>%
  mutate(is_myc = (seqnames == "chr8" & start > 127300000 &
                   start < 128300000 & grepl("chr(2|14|22)", ALT))) %>%
  group_by(patient, is_myc) %>%
  mutate(is_top_myc = ifelse(is_myc, TVAF == max(TVAF), FALSE)) %>% {
  ggplot(., aes(SOMATICSCORE, TVAF, colour = is_top_myc)) +
  geom_point() +
  geom_point(data = filter(., is_top_myc), aes(colour = is_top_myc)) +
  scale_color_manual(values = c(`TRUE` = "red", `FALSE` = "grey"), labels = c("Yes", "No")) +
  scale_x_log10(breaks = c(seq(0, 100, 10), seq(100, 400, 50))) +
  scale_y_continuous(breaks = seq(0, 1, 0.1)) +
  place_legend(c(1,1)) +
  labs(x = "Patient", y = "Tumor variant allele fraction", colour = "MYC translocation")}

scatterplot_manta_raw_bnd_tvaf_somatic_score
manta <- filter(manta_raw, TVAF > 0.1, SOMATICSCORE > 50)