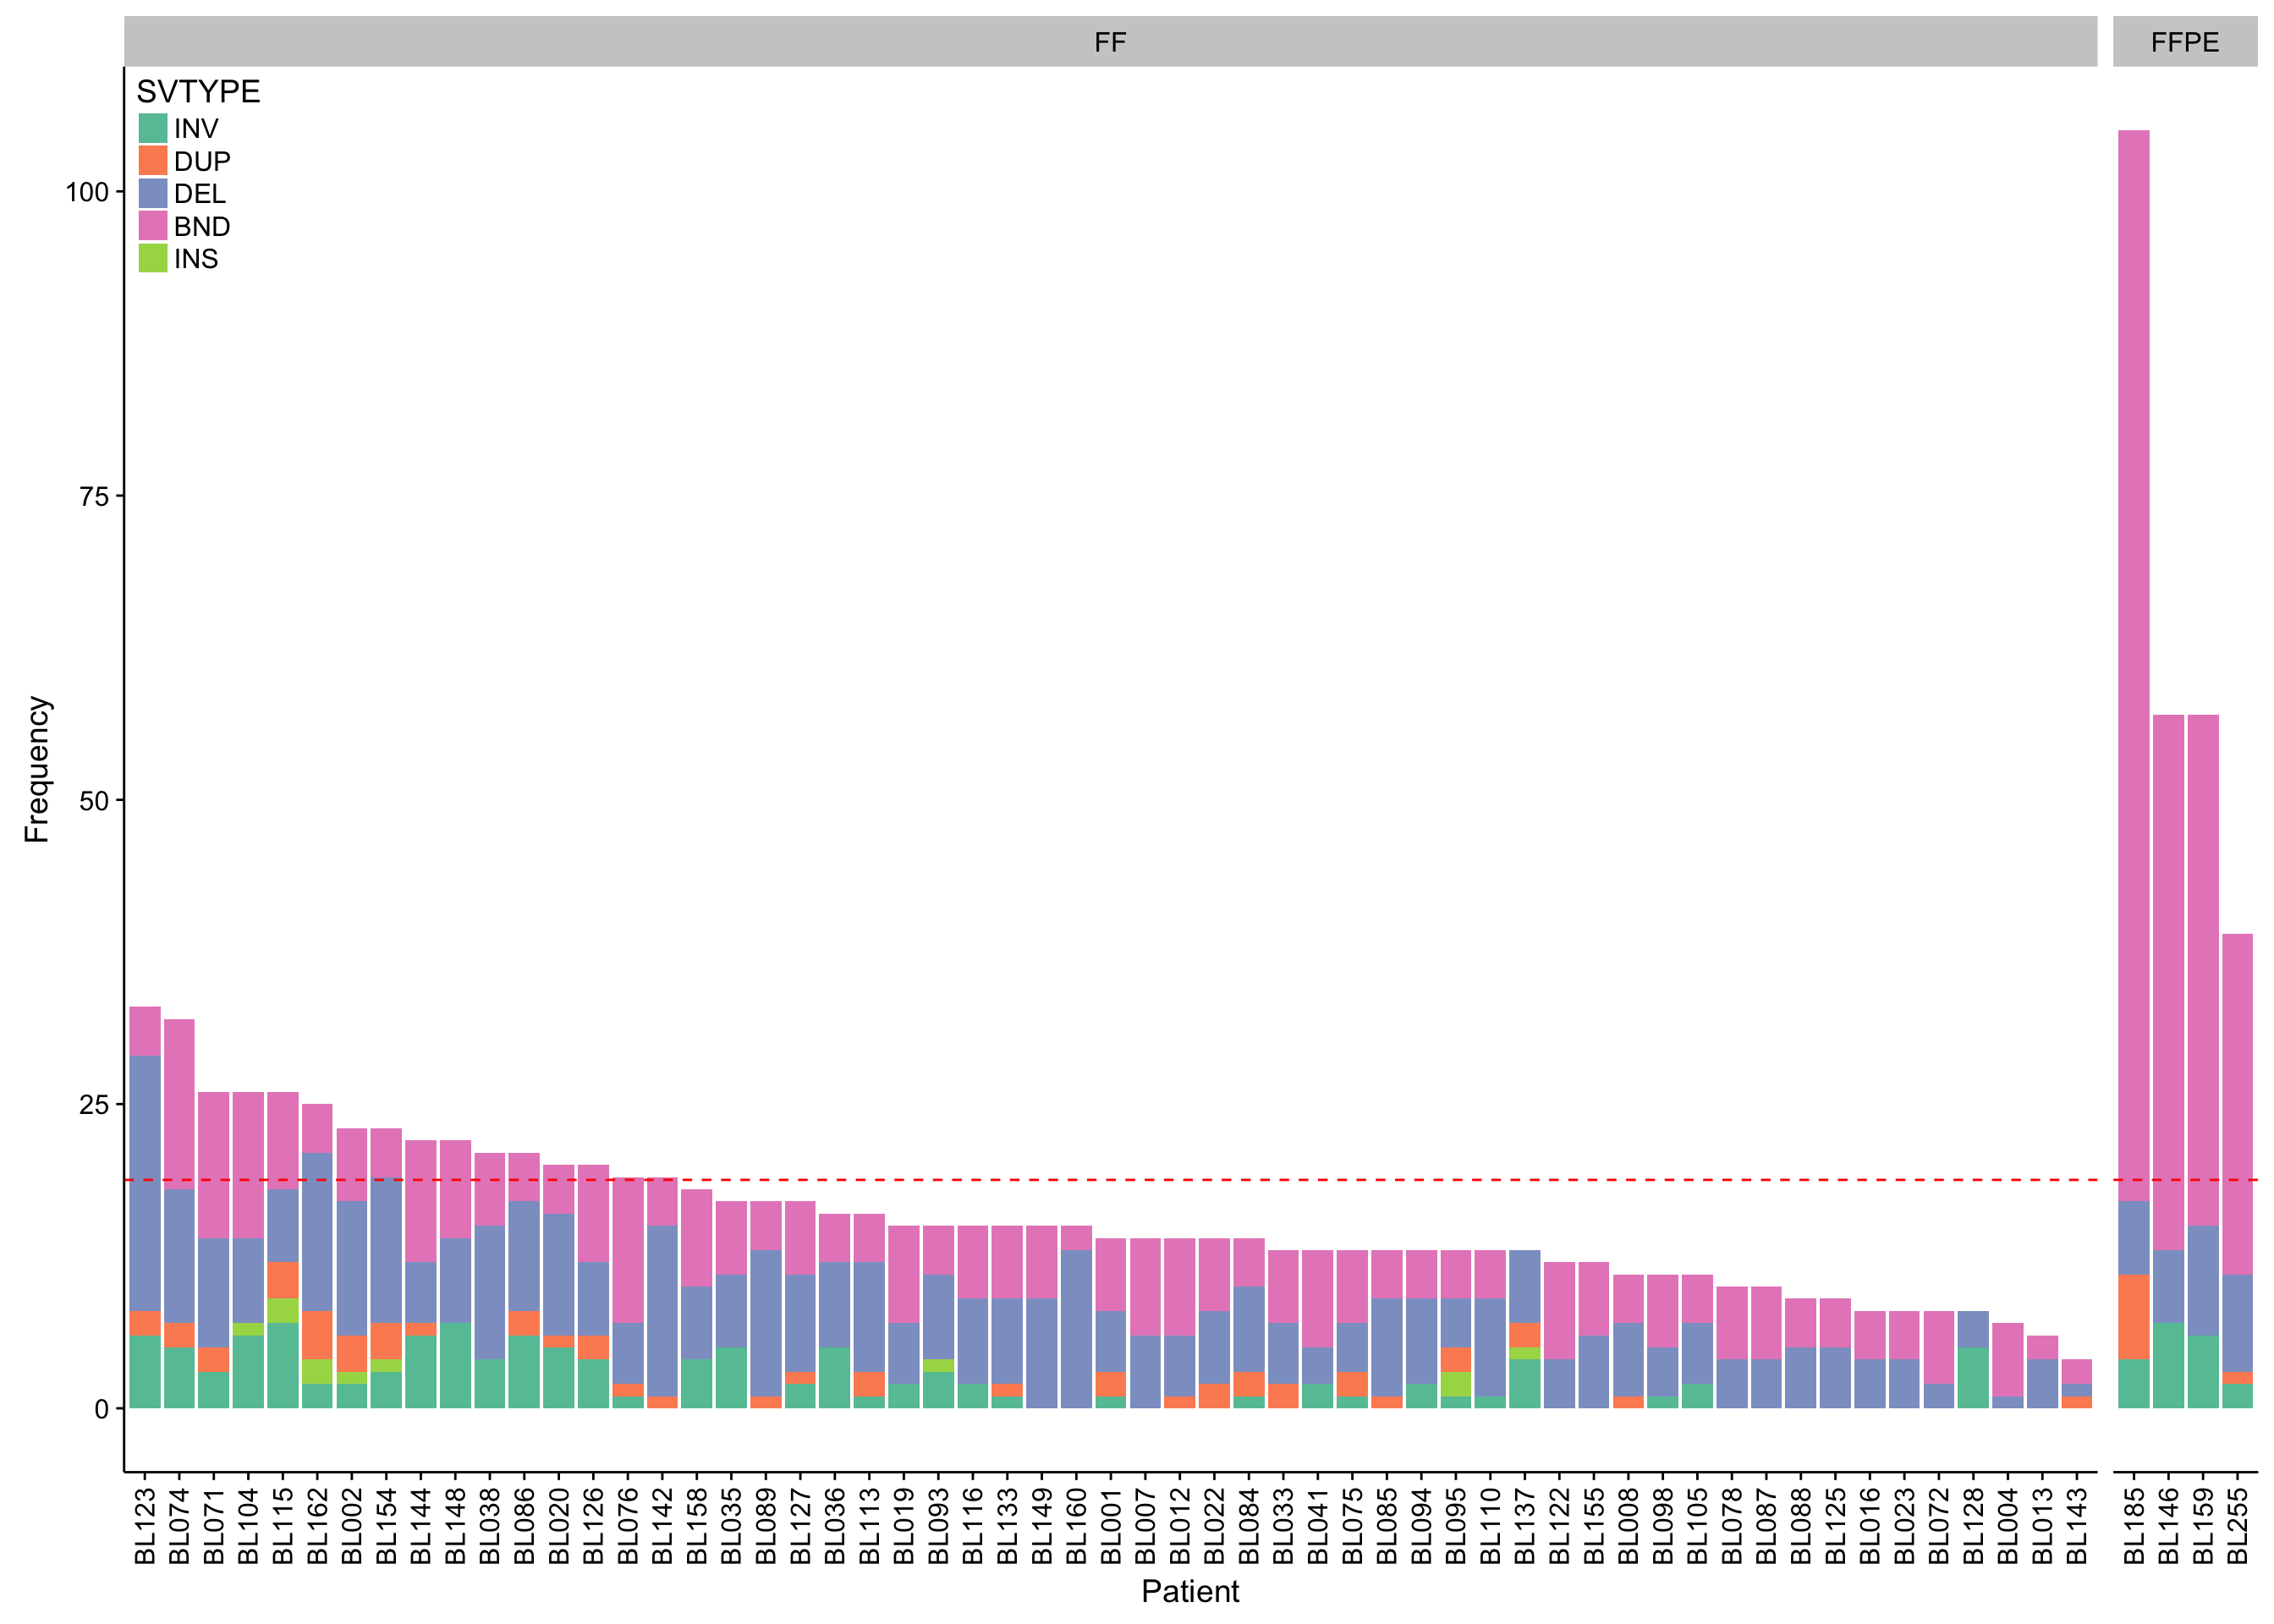
barplot_manta_freq <-
  manta %>%
  count(patient, ff_or_ffpe, SVTYPE) %>%
  ungroup() %>%
  mutate(patient = fct_reorder(patient, -n, sum)) %>% {
  m <- group_by(., patient) %>% summarise(total = sum(n)) %$% mean(total)
  barplot_manta_raw_freq %+% . +
  geom_hline(yintercept = m, colour = "red", linetype = 2) +
  labs(x = "Patient", y = "Frequency")}

barplot_manta_freq
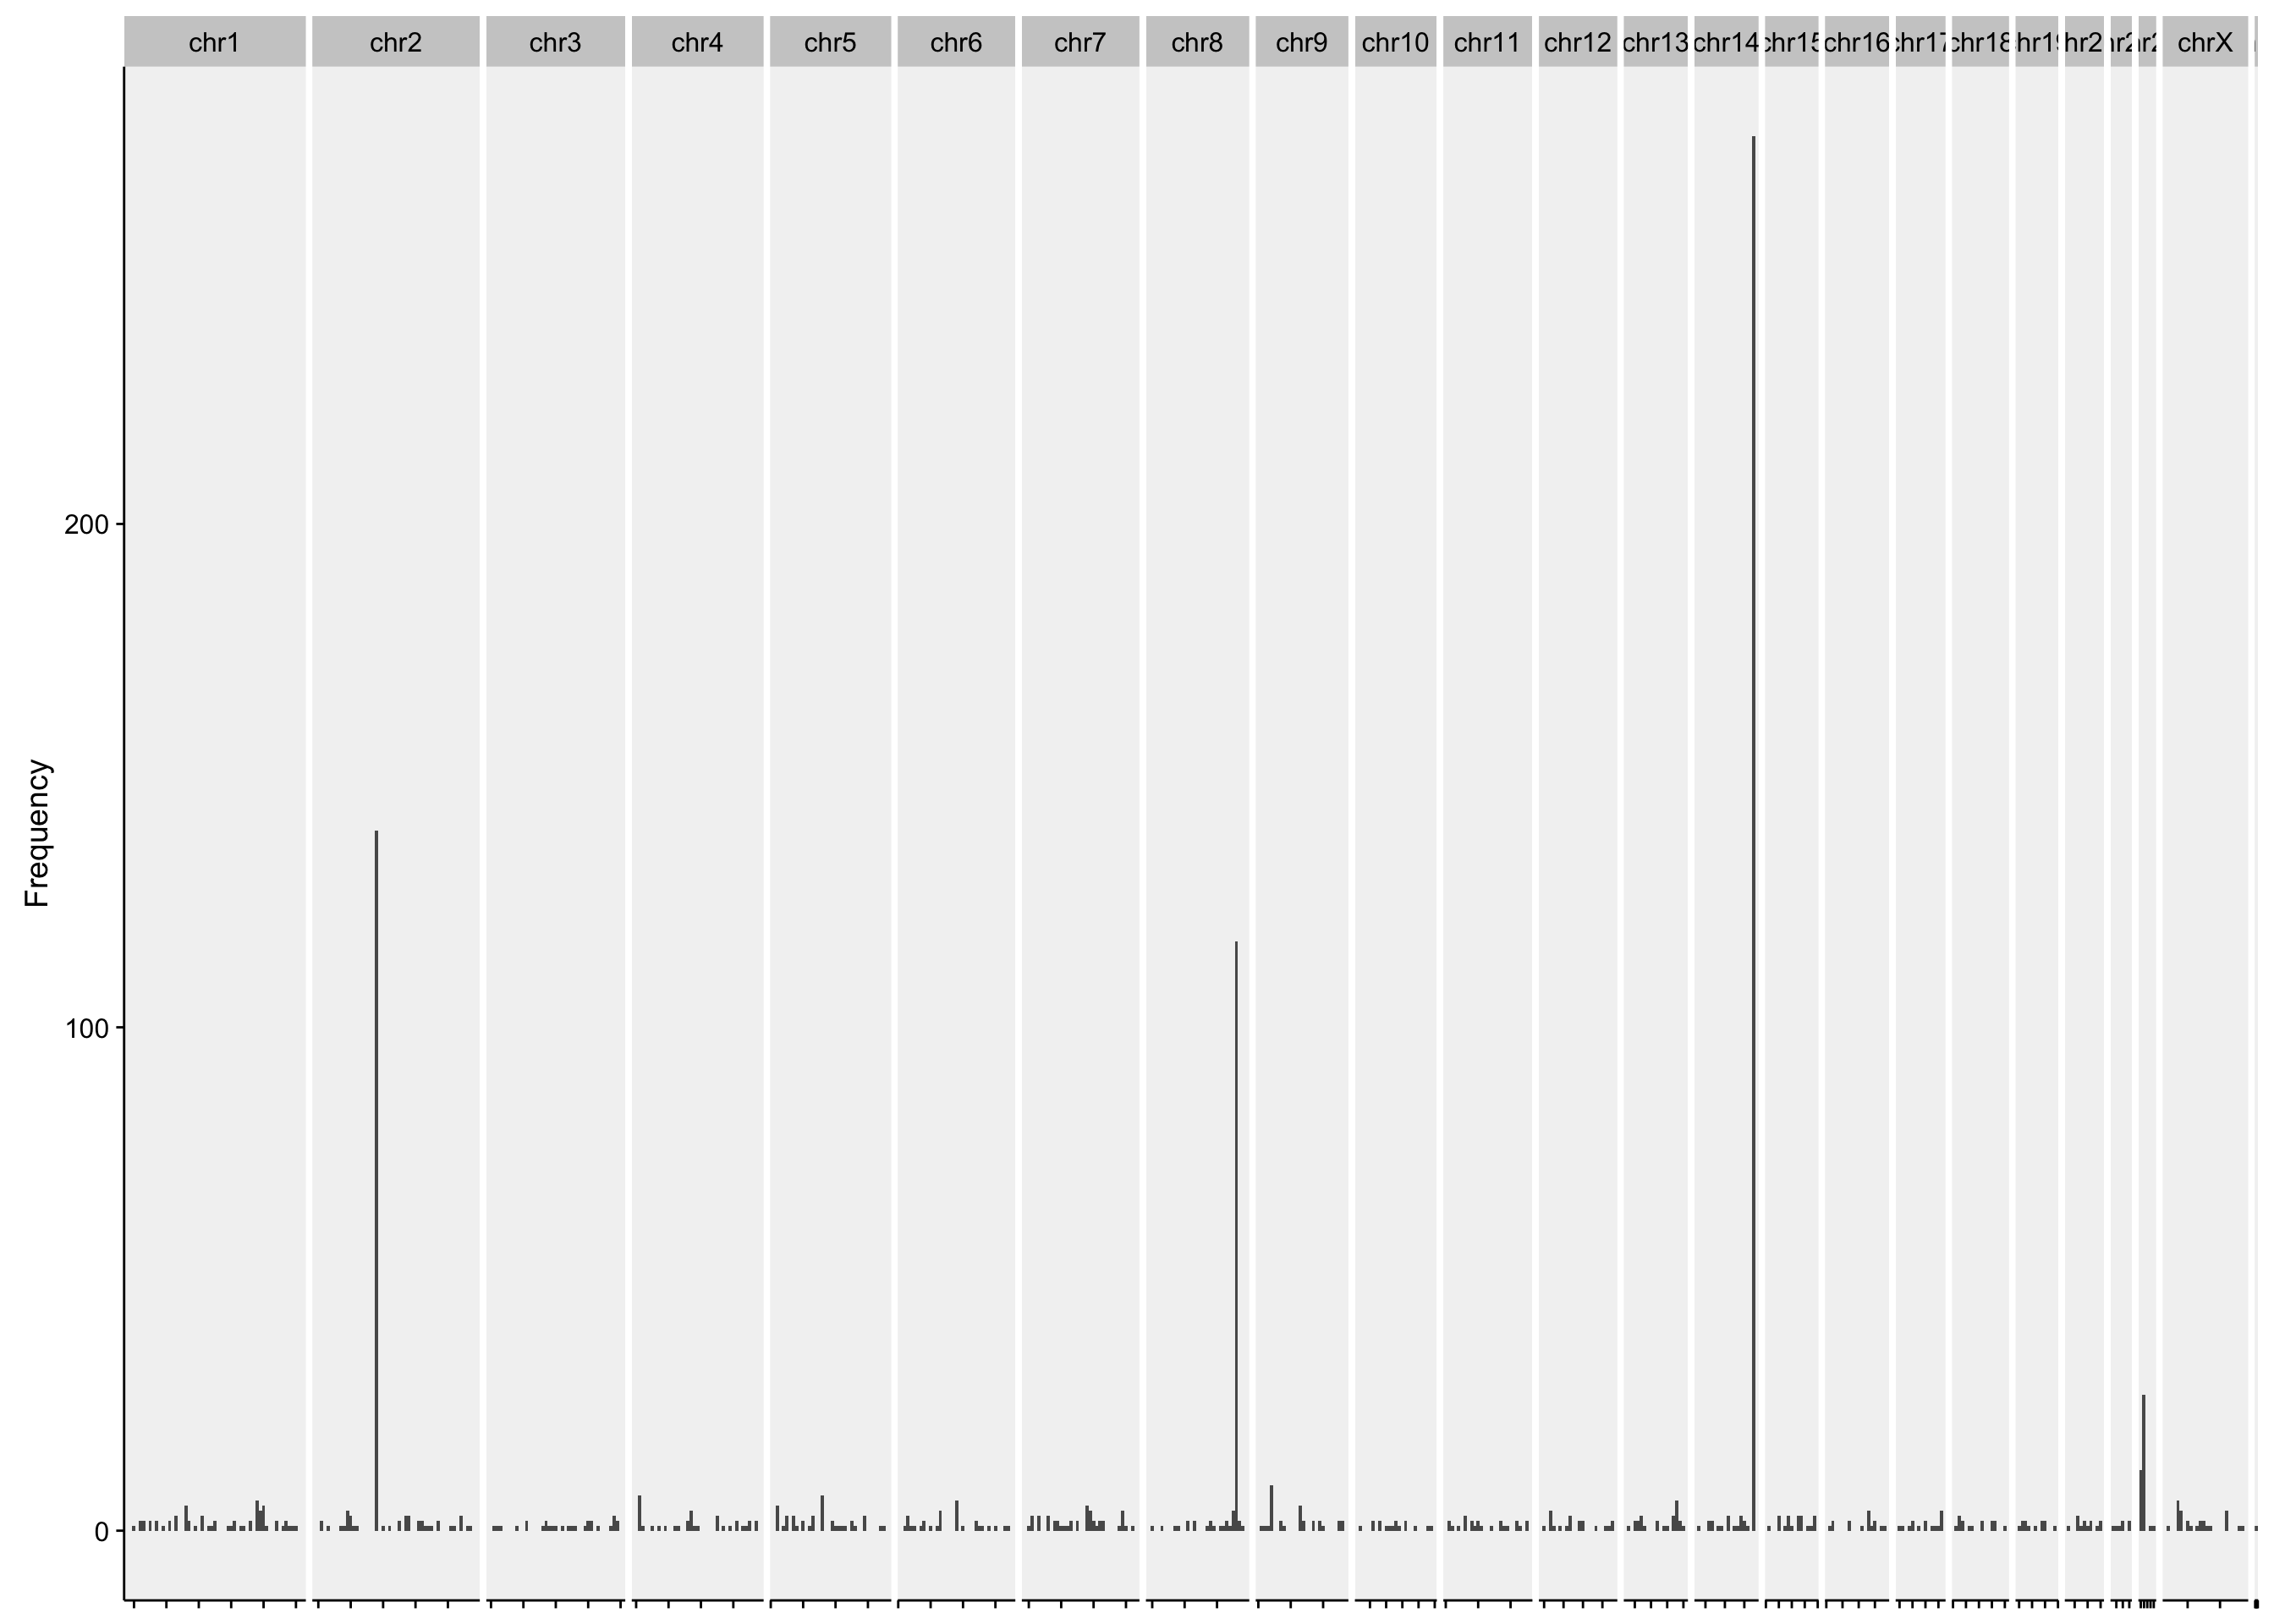
chroms <- paste0("chr", c(1:22, "X", "Y", "EBV"))

histogram_manta <-
  manta %>%
  filter(seqnames %in% chroms) %>%
  mutate(chrom = factor(seqnames, chroms)) %>%
  ggplot(aes(x = start)) +
  geom_histogram(binwidth = 5000000) +
  facet_grid(~seqnames, scales = "free_x", space = "free_x") +
  scale_x_continuous(labels = NULL, name = NULL) +
  # coord_cartesian(ylim = c(0, 10)) +
  theme(
    panel.background = element_rect(fill = "grey95"),
    panel.spacing = unit(0.2, "lines")) +
  labs(y = "Frequency")

histogram_manta