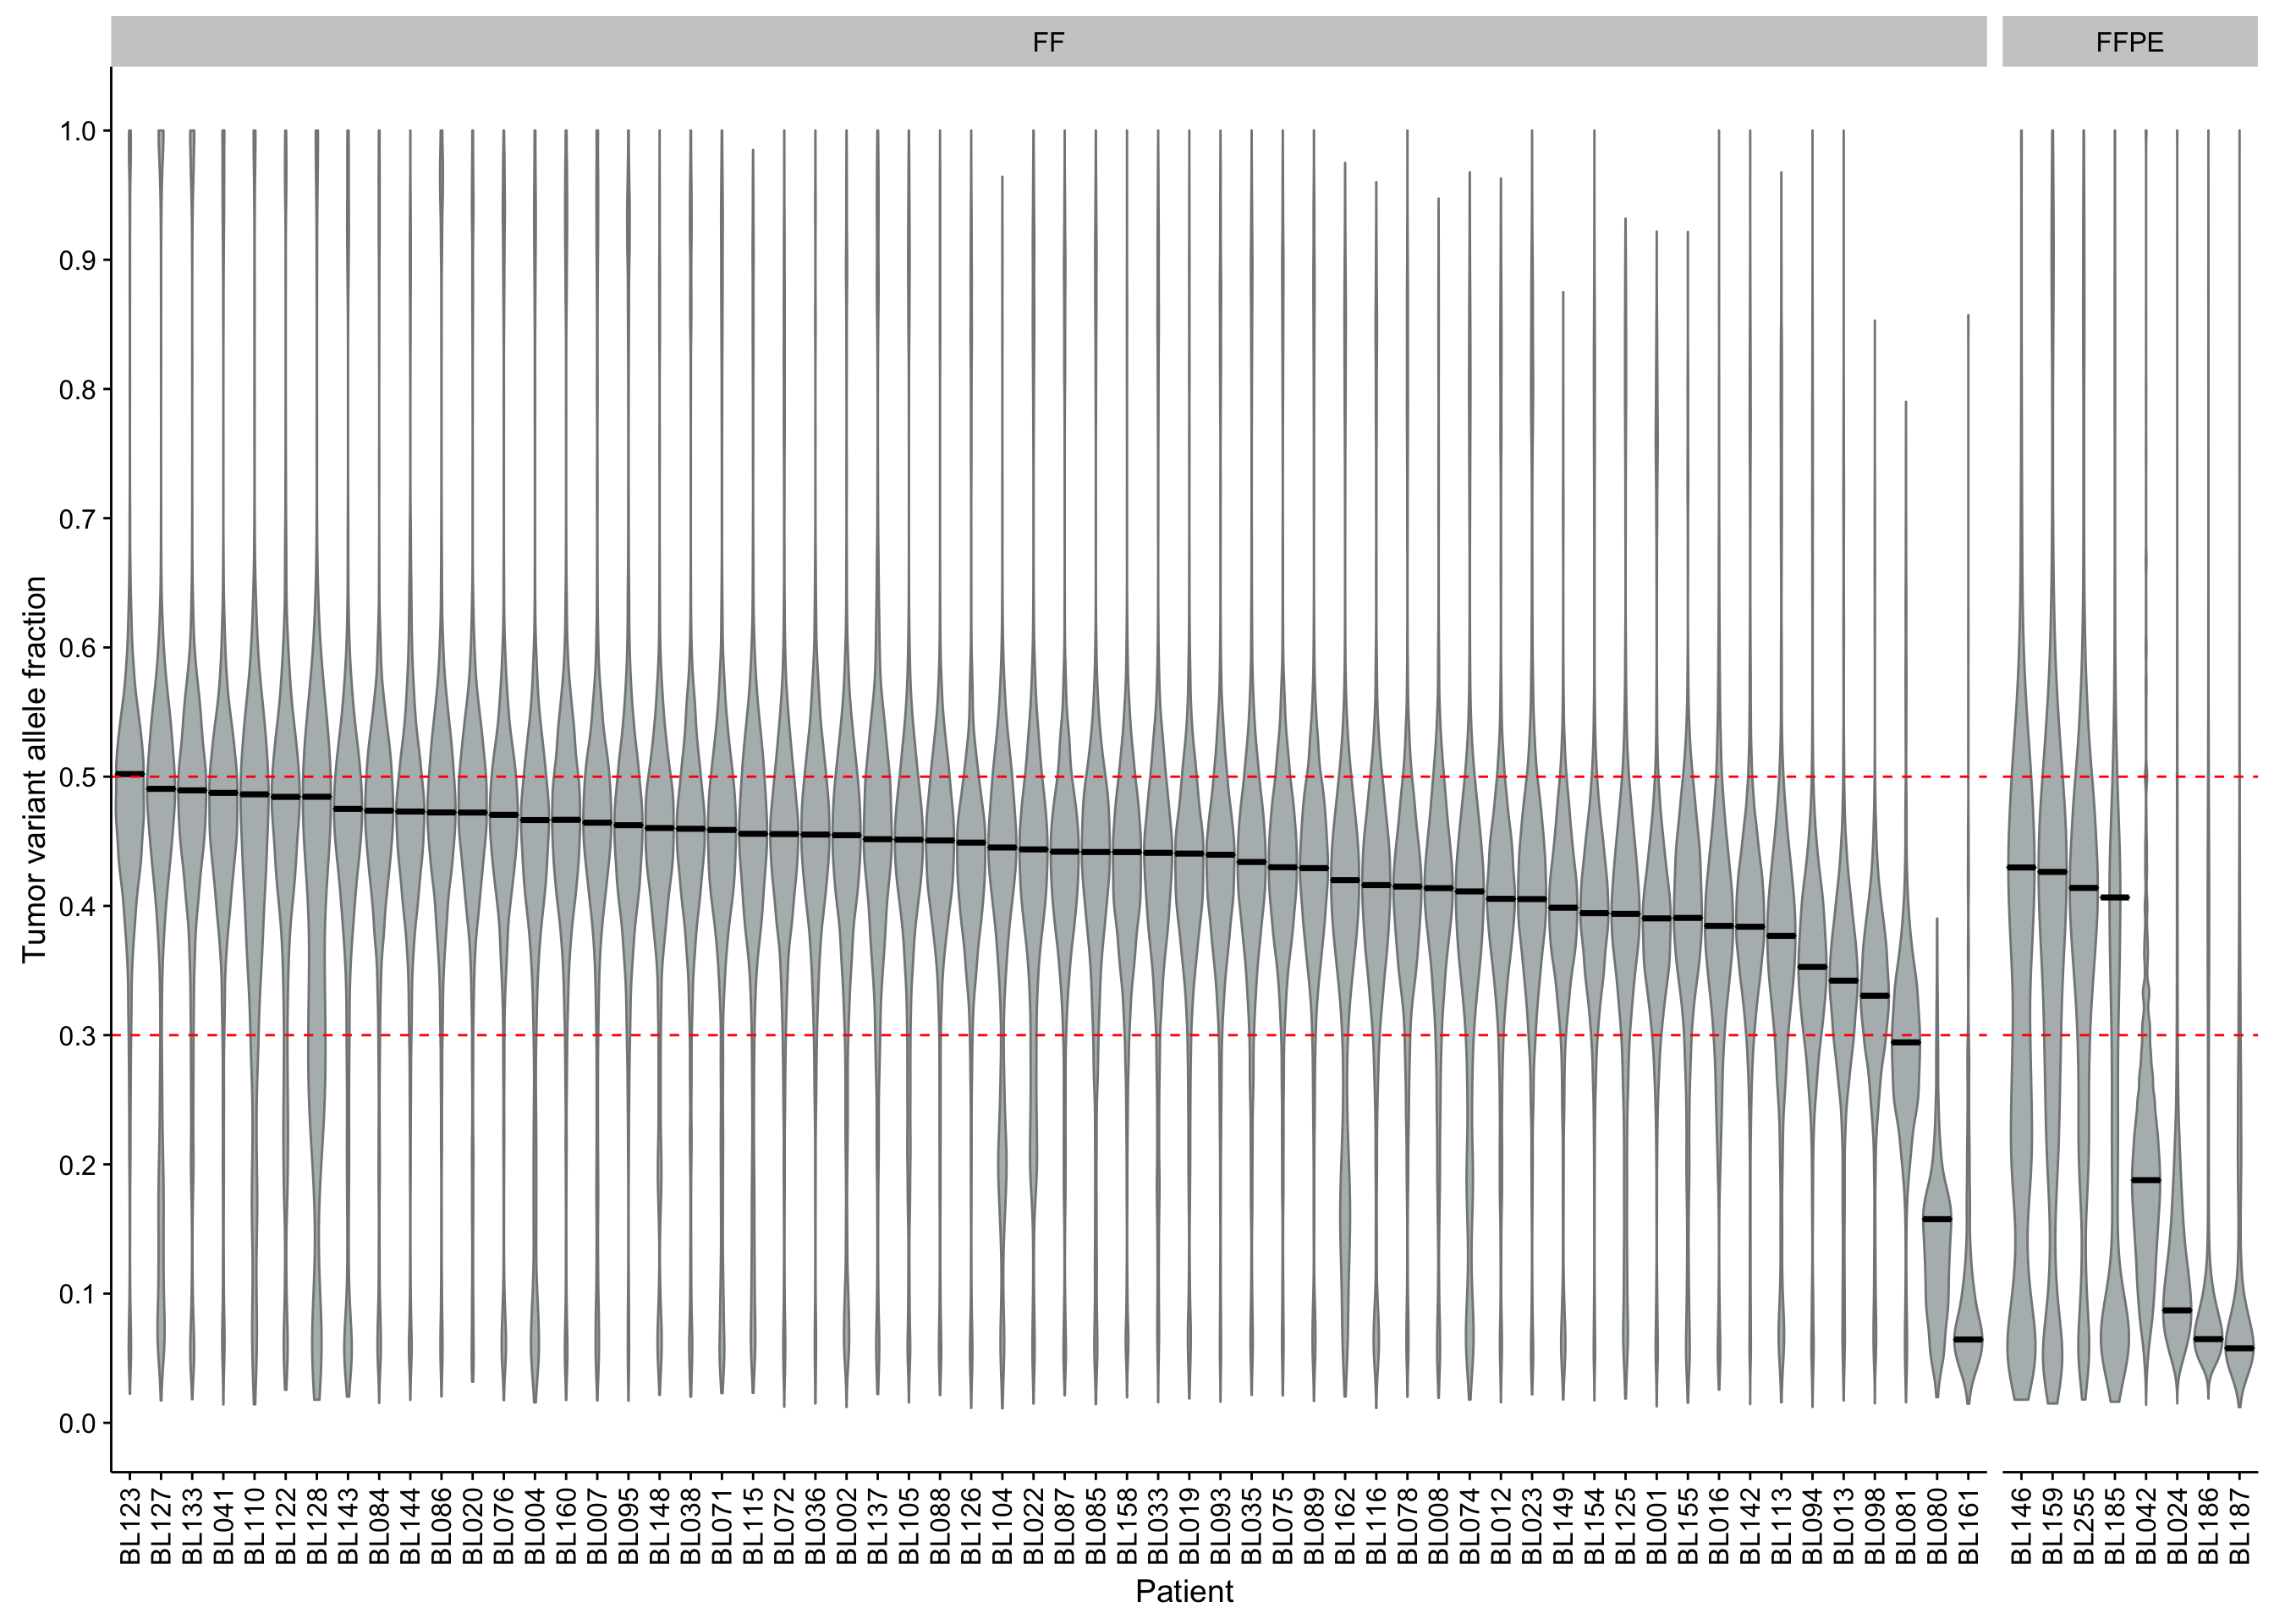
violinplot_maf_all_vaf <-
  maf_all %>%
  mutate(patient = fct_reorder(patient, -tc)) %>% {
  ggplot(., aes(patient, t_vaf)) +
  geom_violin(scale = "width", fill = "#B4BABB", color = "#838788") +
  geom_crossbar(
    data = group_by(., patient) %>% slice(1),
    aes(x = patient, y = vaf_peak, ymin = vaf_peak, ymax = vaf_peak)) +
  geom_hline(yintercept = c(0.3, 0.5), color = "red", linetype = 2) +
  scale_y_continuous(breaks = seq(0, 1, 0.1)) +
  facet_grid(~ff_or_ffpe, scales = "free_x", space = "free_x") +
  rotate_x_text() +
  labs(x = "Patient", y = "Tumor variant allele fraction")}

violinplot_maf_all_vaf
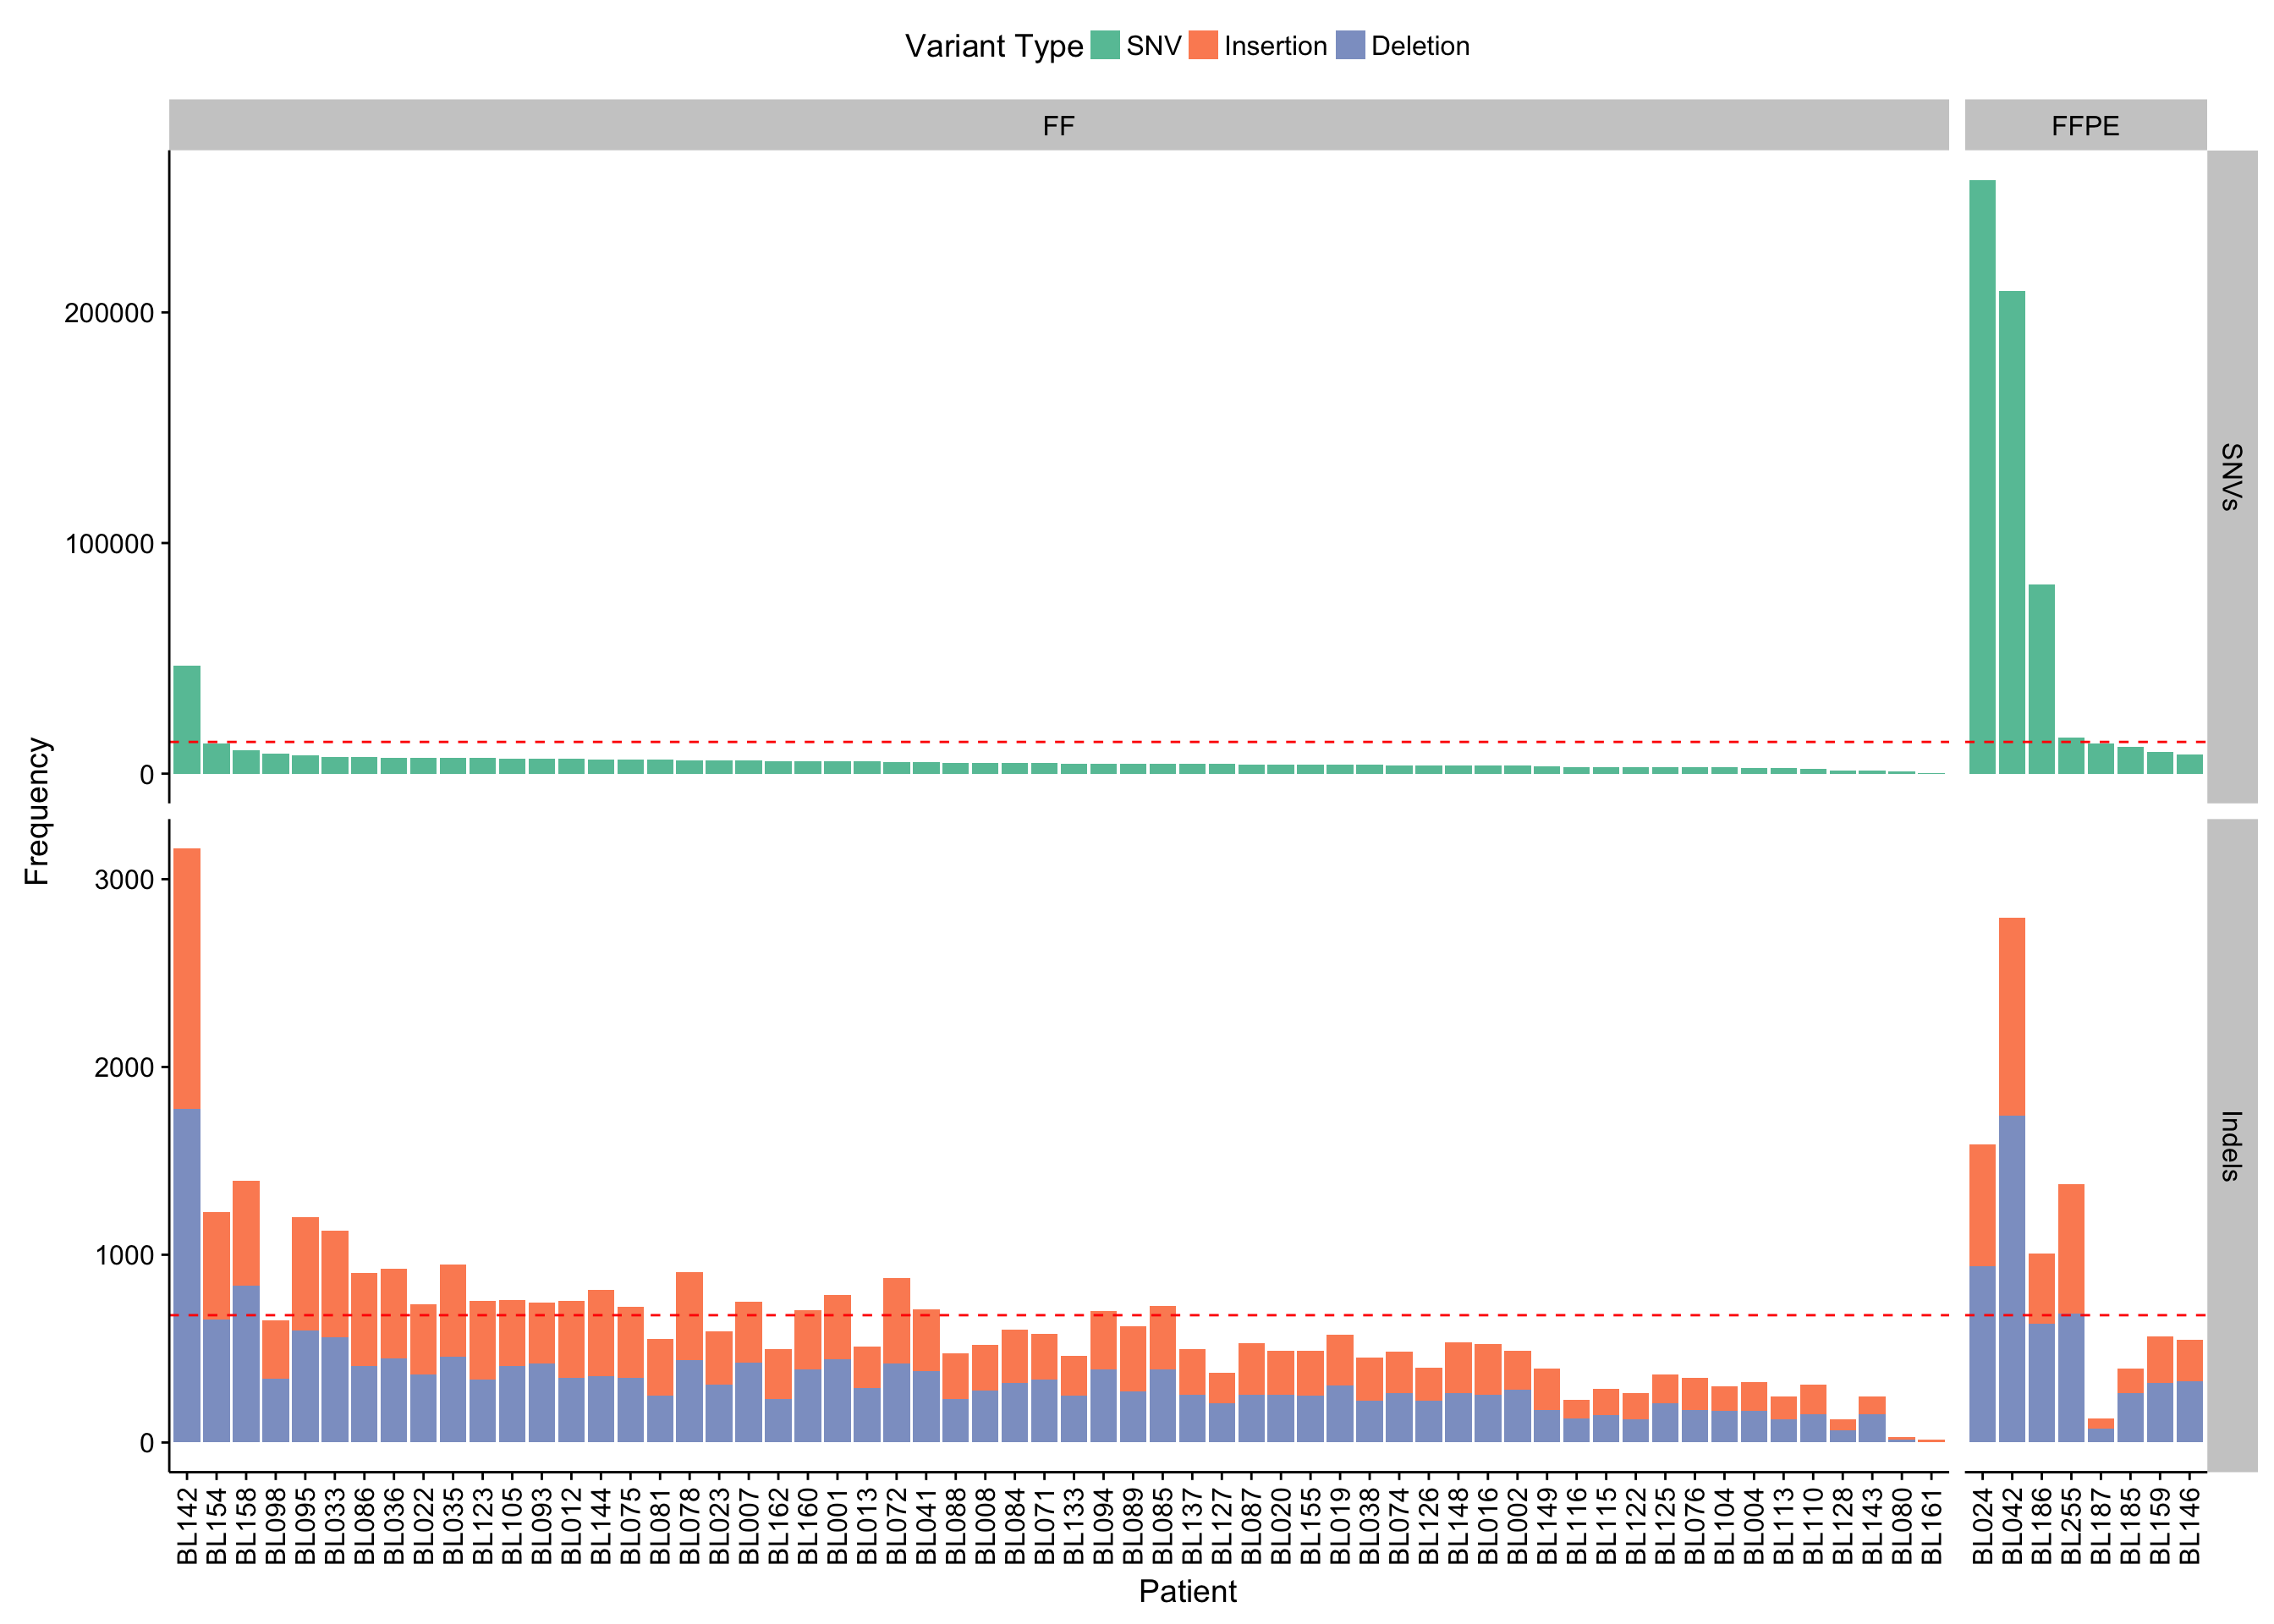
barplot_maf_all_mutfreq_data <-
  maf_all %>%
  dplyr::count(patient, ff_or_ffpe, Variant_Type) %>%
  dplyr::ungroup() %>%
  tidyr::spread(Variant_Type, n) %>%
  dplyr::mutate(patient = forcats::fct_reorder(patient, -SNP)) %>%
  tidyr::gather(Variant_Type, n, -patient, -ff_or_ffpe) %>%
  dplyr::mutate(
    Variant_Type = dplyr::recode_factor(
      Variant_Type, SNP = "SNV", INS = "Insertion", DEL = "Deletion"),
    Variant_Class = dplyr::recode_factor(
      Variant_Type, SNV = "SNVs", Insertion = "Indels", Deletion = "Indels"))

barplot_maf_all_mutfreq_stats <-
  barplot_maf_all_mutfreq_data %>%
  dplyr::group_by(Variant_Class, patient) %>%
  dplyr::summarise(n = sum(n)) %>%
  dplyr::summarise(n_patients = dplyr::n_distinct(patient),
                   max = max(n),
                   mean = round(mean(n)))

barplot_maf_all_mutfreq <-
  ggplot(barplot_maf_all_mutfreq_data) +
  geom_col(aes(x = patient, y = n, fill = Variant_Type)) +
  geom_hline(data = barplot_maf_all_mutfreq_stats, aes(yintercept = mean),
             colour = "red", linetype = 2) +
  facet_grid(Variant_Class ~ ff_or_ffpe, scales = "free", space = "free_x") +
  scale_fill_brewer(palette = "Set2") +
  theme(legend.position = "top") +
  rotate_x_text() +
  labs(y = "Frequency", x = "Patient", fill = "Variant Type")

barplot_maf_all_mutfreq