|
|
Preamble This section provides a brief description of validation experiments conducted with microarray created with the ALEXA platform. This information is supplementary to that contained in the ALEXA platform publication. For complete results and discussion of these experiments please refer to the manuscript and supplementary materials. Furthermore, the discussion and figures below pertain only to the experimental design, analysis and technical validation. For further details of the biological findings, refer to the manuscript. A package of data files is also described below. This contains data files describing the validation arrays, raw data and summarized results. These are also described as Supplementary Data 1 in the Supplementary Materials of the manuscript. Citation: Malachi Griffith, Michelle J. Tang, Obi L. Griffith, Ryan D. Morin, Susanna Y. Chan, Jennifer K. Asano, Thomas Zeng,
Stephane Flibotte, Adrian Ally, Agnes Baross, Martin Hirst, Steven J.M. Jones, Gregg B. Morin, Isabella T. Tai
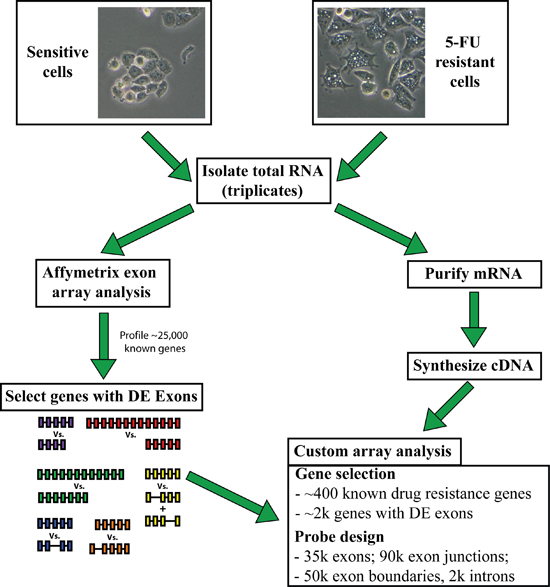
and Marco A. Marra. Experimental overview Experiments conducted to validate the ALEXA platform consisted of a cross-platform comparison between an ALEXA design and the Affymetrix Exon Array platform, both hybridized with the same 6 RNA samples extracted from 5-FU sensitive and resistant colorectal cancer cell lines. Refer to the manuscript for complete details of the differences in array strategy between the two platforms. Figure 1 provides a brief experimental overview. Figure 1. Differential expression analysis of 5-FU sensitive and resistant cells RNA samples extracted from 5-FU sensitive and resistance colorectal cancer cell lines (Tai et al. 2005). were analysed on both Affymetrix exon arrays and our own ALEXA custom arrays.
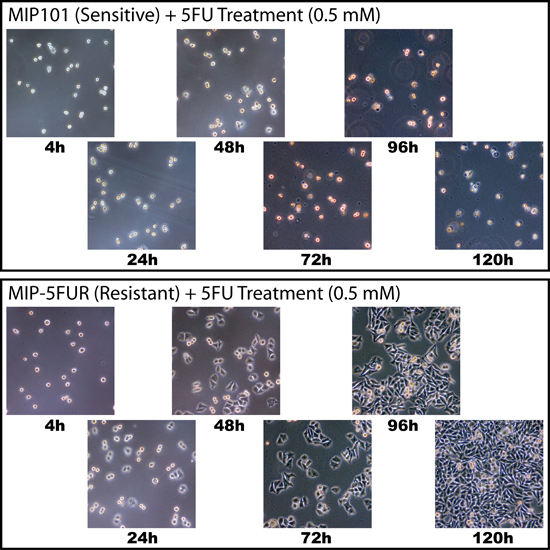
Sample description The samples used for validation experiments were extracted in biological triplicate from 5-FU sensitive and resistant cancer cell lines. The sensitive cell line, MIP101, is a poorly differentiated colorectal cancer cell line (Wagner et al. 1990). The resistant cell line, MIP5FUR, is a derivative of MIP101 made resistant to 5-FU (Tai et al. 2005). A simple test of the resistance of this cell line compared to its parental line is shown in Figure 2. Note that when RNA was isolated for expression analysis, the cells were NOT being exposed to the drug. Figure 2. 5-FU resistance test Approximately one million MIP101 and MIP5FUR cells were seeded onto 10cm plates, containing DMEM supplemented with 0.5 mM concentration of 5-FU. Cultures were maintained in a humidified environment of 5% CO2 and photographed every 24 hours.
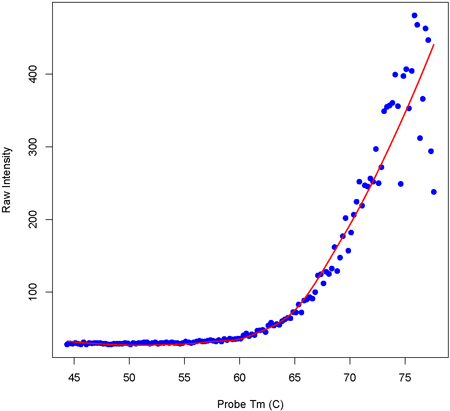
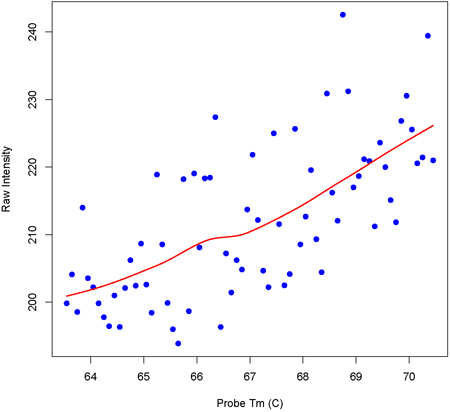
Sample preparation Total RNA was isolated with Trizol reagent. Samples were then DNaseI treated followed by cleanup on a Qiagen RNeasy column. Quantity and Quality of RNA was determined by analysis on an Agilent 2100 Bioanalyzer. All samples had an Agilent RNA integrity score of 9.7 (of 10) or higher. For both Affymetrix and ALEXA (NimbleGen synthesized) arrays, we then followed the array manufacturer's instructions for sample preparation, labeling, hybridization, etc. A brief outline of the process for each platform is outlined below. Affymetrix exon arrays Briefly, the Affymetrix hybridization procedure consists of ribosomal RNA reduction of total RNA, 1st cycle double stranded cDNA synthesis, linear amplification by in vitro transcription, 2nd cycle single stranded cDNA synthesis, enzymatic fragmentation, terminal labeling of fragments, hybridization, washing, staining and scanning. ALEXA custom alternative expression arrays To prepare samples for hybridizations to the validation ALEXA arrays, polyA+ RNA was isolated from total RNA with a �MACS mRNA isolation kit followed by double stranded cDNA synthesis with a �Superscript Choice System� for cDNA Synthesis using random hexamers. 5 �g of each cDNA sample was shipped to NimbleGen. Labeling, hybridization and scanning was conducted by NimbleGen using their �ChIP-chip� protocol (optimized for 50-mers) and raw data was returned to us. Pre-processing of data Raw Affymetrix probe intensity values were extracted from .CEL files using Affymetrix's 'Exact-Probe-Intensity-Extraction' tool. Raw probe values for ALEXA arrays were provided directly by NimbleGen. The ALEXA design contained ~4,300 randomly generated probe sequences and the Affymetrix design contained ~17,000 �anti-genomic� probes. In both platforms these probes were selected to uniformly represent the Tm of all experimental probes. For each array hybridization on both platforms, a loess model was fit to a plot of probe intensity versus Tm for all random probes. Figure 3a,b shows examples of these fits for a single sample analyzed with both platforms. Using these plots, a Tm-specific estimate of background hybridization was then estimated for every probe on the array by interpolating from the loess model fit. This value was subtracted from the observed intensity and an arbitrary value of 16 was added according to Affymetrix's recommendations for stabilizing variance. The data was then normalized across the arrays within each platform by quantiles normalization. Figure 3a. Loess fit to intensity versus Tm values (Affymetrix data)
Figure 3b. Loess fit to intensity versus Tm values (ALEXA data)
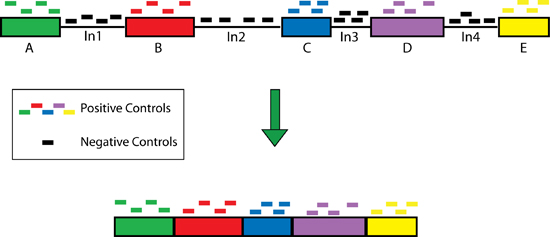
Analysis of controls To assess the relative performance of each platform, probes corresponding to ~100 housekeeping genes targeted by both platforms were analysed in detail (see manuscript for additional info). Figure 4 below shows the probe selection strategy for these genes. Figure 5 is a snapshot of a custom UCSC track depicting the expression of a single one of these genes observed for in a single sample on the ALEXA platform. Finally, Figures 6 summarize the expression values observed for all exon, intron and negative control (random sequence) probes for a single sample analyzed on both platforms. Figure 4. Housekeeping controls Signal-to-noise ratios were determined by examining expression for probes corresponding to the exons and introns of ~100 housekeeping genes. The position of such probes within a hypothetical gene with 5 exons and 4 introns is depicted
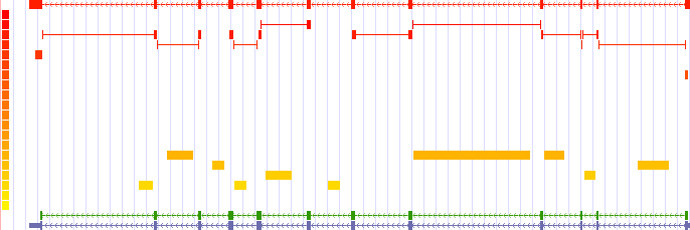
Figure 5. Expression observed for a single housekeeping gene (HSPC117) Custom UCSC tracks were generated to represent expression values divided into 20 quantile bins on a log2 scale. Each bin corresponds to ~0.5 on a log2 scale, starting at ~4 (yellow) and going up to ~16 (red). The gene model is depicted at the top and bottom of the panel. Within the centre of the panel, probesets are positioned and colored according to their level of expression. Exon and intron probesets are depicted as small rectangles. The width of each rectangle represents the the region occupied by the individual probes of the probeset. Probesets consisting of rectangles connected by lines represent canonical exon junction probes. Alternative exon junction and boundary probesets for this locus are not shown in this plot.
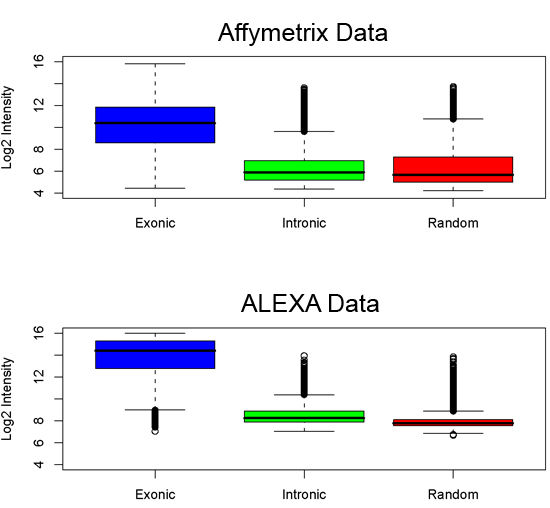
Figure 6. Distribution of probe intensities for housekeeping genes according to probe type The distribution of probe intensities for exon, intron and negative control probes in each platform for a single sample analyzed on both platforms are displayed box plots.
Supplementary Data Files Array design and annotation files as well as raw data and results files can be downloaded as a zip archive: Supplementary-Data-1.zip. These are described as 'Supplementary Data 1' in the manuscript. A complete description of these files is available: Supplementary-Data-1.pdf. |