|
|
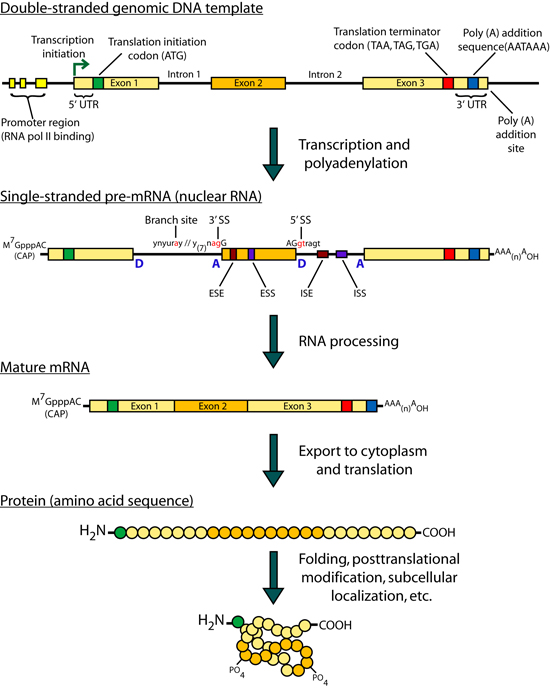
Introduction Some genes in metazoan genomes appear to follow a 'one-gene, one-transcript, one-protein' rule. However, transcription at most gene loci generates a diversity of alternate transcripts (isoforms) by the use of alternative transcription initiation, splicing and polyadenylation sites (collectively referred to as alternative expression or 'AE' events). Figures 1 and 2 briefly outline the process of gene transcription and enumerate some of the categories of alternative transcription events. Early efforts to study the transcriptional diversity of genomes have focused on the use of a variety of sequencing technologies and the application of new sequencing platforms to this area continues. These technologies are summarized briefly in Figure 3. cDNA and Oligonucleotide microarrays have also been suggested as a means of studying alternative transcription patterns across tissues and developmental stages as well as in disease models. The development of expression microarrays towards this end is summarized in Figure 4. The idea of using ‘splicing’ microarrays consisting of exon-junction and other probe configurations to detect such alternative transcription events was first suggested by Douglas Black (Black, 2000). Since 2002, a number of groups have begun to experiment with arrays capable of measuring mRNA expression at the level of AE events (early efforts were reviewed by (Lee and Roy, 2004)). A number of works have specifically addressed the theoretical and practical issues of designing custom splicing microarrays to detect AT events by conducting proof-of-principle experiments in a variety of metazoan species (Srinivasan et al., 2005; Castle et al., 2003; Clark et al., 2002; Johnson et al., 2003; Stolc et al., 2004; Pan et al., 2004). Additional studies have focused on developing analysis methods for the data generated from these arrays: Splicing index values (Clark et al., 2002 ; Li et al., 2006), ASAP (Le et al., 2004), splice and neighborhood algorithms (Fan et al., 2006; Hu et al., 2001), ANOSVA (Cline et al., 2005), sequence based splice variant deconvolution (Wang et al., 2003) and GeneASAP (Shai et al., 2006). Finally, a small number of experiments have used these arrays for the study of particular biological questions (Relogio et al., 2004; Li et al., 2006; Zhang et al., 2006; Sugnet et al., 2006; Ule et al., 2006; Blanchette et al., 2005; Ule et al., 2005) Figures 1-4 shown below are taken from the following book chapter which contains a complete discussion of this topic: Alternative expression analysis: experimental and bioinformatic approaches for the analysis of transcript diversity. Malachi Griffith and Marco A. Marra. Genes, Genomes, and Genomics. Vol. 2. 2007. Regency Publications. New Delhi. The ALEXA Platform The purpose of the computational platform described in the publication (Griffith et. al. 2007) is to facilitate the use of custom microarrays for the study of alternative transcription events. Although a number of publications have described the use of such arrays the designs are generally not readily available and have only been created for select species. ALEXA offers the capability to generate custom arrays for most EnsEMBL species and provides a design that is annotated to the level of genes, transcripts, exons, and individual probes. The platform itself consists of Perl and R scripts and modules, a mySQL relational database and an associated API for interacting with the database. This platform takes as input, a complete set of EnsEMBL gene models for a single species and generates a complete set of probes corresponding to the exons, introns, exon-junctions and exon-boundaries of these genes. Figure 5 depicts the selection of probe sequences from a single gene. These probes are then scored and filtered according to their specificity and thermodynamic properties. Finally, in addition to the platform, pre-computed designs are provided for several EnsEMBL species. Since the design process is computationally intense, it may be desirable to use these designs directly. They may also be used as guides for those who wish to create their own design. Figures Figure 1. Gene transcription and RNA processing Expression of a typical protein-coding gene involves: gene transcription, pre-mRNA processing and polyadenylation. Each of these processes is regulated by components of the transcription machinery which recognize sequence motifs in the DNA template and pre-mRNA molecule. After pre-mRNA processing, the mRNA is exported to the cytoplasm where ribosomes translate it into protein. Abbreviations: (UTR) untranslated region; (D) donor site; (A) acceptor site; (SS) splice site; (ESE) exonic splicing enhancer; (ESS) exonic splicing silencer; (ISE) intronic splicing enhancer; (ISS) intronic splicing silencer.
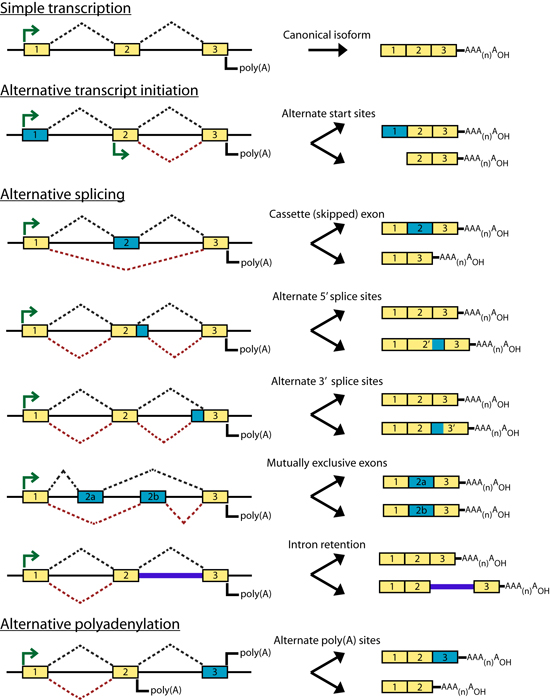
Figure 2. Types of alternative expression (AE) Gene models are depicted as exons (colored rectangles) connected by introns (black lines). Green arrows indicate transcription initiation sites, dotted lines indicate splicing patterns and polyadenylation sites are denoted as ‘poly (A)’. The mRNA products generated by each type of AT are shown to the right of each gene model. Simple transcription is contrasted with alternative transcript initiation, the five major classes of alternative splicing, and alternative polyadenylation. In each model, yellow exons are constitutive and blue exons are alternative.
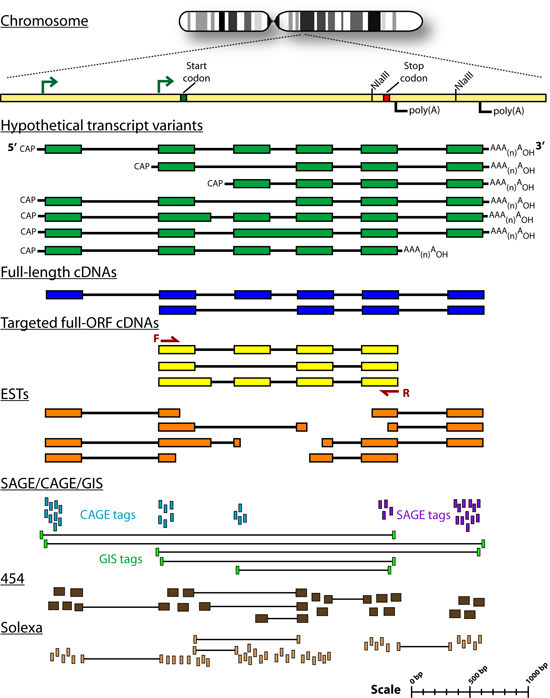
Figure 3. Sequence-based methods for profiling transcript diversity Hypothetical transcript sequences consisting of exons (green rectangles) with intervening introns (black lines) are depicted as gapped alignments to a reference genome. The following tracks represent sequences generated by each sequence-based method. Human genes have an average of 10 exons with an average length of 250 bp. The methods are displayed in order of least to most quantitative. Abbreviations: (EST) expressed sequence tag; (SAGE) serial analysis of gene expression; (CAGE) capped analysis of gene expression; (GIS) gene identification signature.
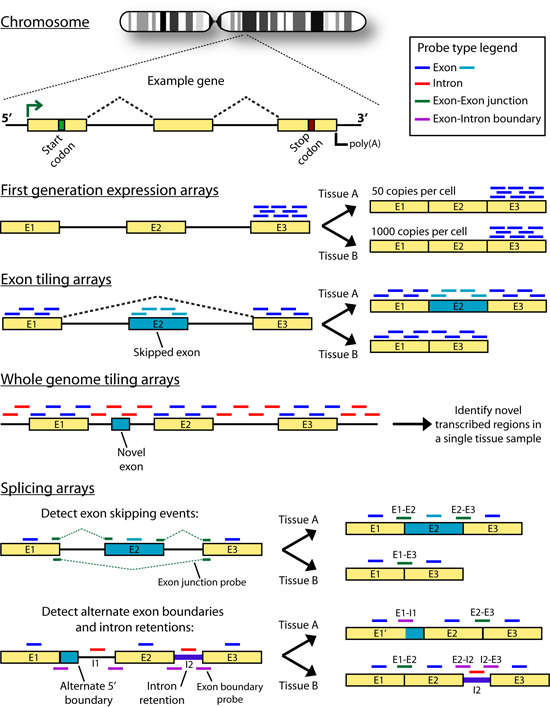
Figure 4. Microarray based methods for profiling transcript diversity Gene models are depicted as exons (colored rectangles) connected by introns (black lines). Hypothetical differences in mRNA products which can be detected by each array method are depicted to the right of each gene model. In each model, yellow exons are constitutive and blue exons are alternative. Differences in array design strategy, particularly the position and types of oligonucleotide probes used are shown above each gene model as colored horizontal lines.
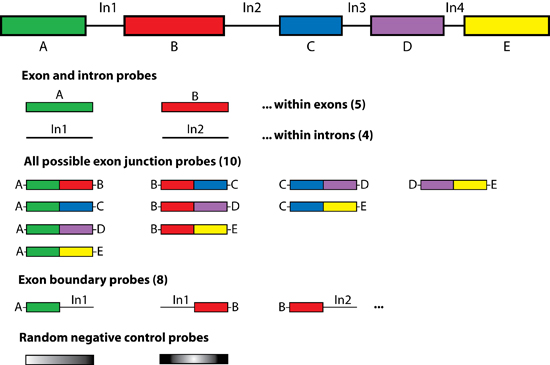
Figure 5. ALEXA array design strategy Diagram illustrating the concept of oligonucleotide probes in an ALEXA design. Shown is a cartoon of a gene with five differently colored exons separated by introns. For this gene there are 10 possible exon-exon junctions. In general, there are (n!/[[n-2]!2!]) possible exon junctions, where n is the number of exons in a gene. For each gene, oligonucleotide probes are also designed to represent the ([n×2]-2) exon-intron junctions. Probes contained within the boundaries of each exon and intron are also selected In this hypothetical example 27 oligonucleotide probes would be designed.
|