HVNC1
Bruno Grande
2016-12-03 22:11:02
HVCN1-mutated Cases per COO
hvcn1 <-
  muts %>%
  dplyr::filter(gene == "HVCN1")

patients_hvcn1 <- unique(hvcn1$patient)

coo_hvcn1 <-
  coo %>%
  dplyr::filter(patient %in% muts$patient,
                coo_ns %in% c("ABC", "GCB")) %>%
  dplyr::mutate(hvcn1_status = patient %in% patients_hvcn1)

coo_hvcn1 %>%
  dplyr::group_by(coo_ns) %>%
  dplyr::summarize(hvcn1_mutant = sum(hvcn1_status),
                   total = length(patient),
                   prop = round(hvcn1_mutant / total, 3)) %>%
knitr::kable()| coo_ns | hvcn1_mutant | total | prop |
|---|---|---|---|
| ABC | 1 | 98 | 0.010 |
| GCB | 10 | 179 | 0.056 |
Fisher’s Exact Test
Testing for the association of HVCN1 mutations with COO.
fisher_hvcn1 <-
  coo_hvcn1 %>%
  dplyr::mutate(hvcn1_status = patient %in% patients_hvcn1) %$%
  table(coo_ns, hvcn1_status) %>%
  fisher.test()
fisher_hvcn1
    Fisher's Exact Test for Count Data

data:  .
p-value = 0.1037
alternative hypothesis: true odds ratio is not equal to 1
95 percent confidence interval:
   0.7915634 251.3437585
sample estimates:
odds ratio
  5.713819
Differential Expression of HVCN1
Boxplots
Across all DLBCL samples
texpr_hvcn1_all <-
  texpr["HVCN1", , drop = FALSE] %>%
  t() %>%
  as.data.frame() %>%
  tibble::rownames_to_column("patient") %>%
  dplyr::mutate(hvcn1_status = ifelse(patient %in% patients_hvcn1, "Mutated", "Not Mutated")) %>%
  dplyr::rename(expr = HVCN1)

boxplot_hvcn1_expr_all <-
  texpr_hvcn1_all %>%
  ggplot(aes(x = hvcn1_status, y = expr)) +
  geom_boxplot() +
  geom_jitter(position = position_jitter(width = 0.5, height = 0))
boxplot_hvcn1_expr_all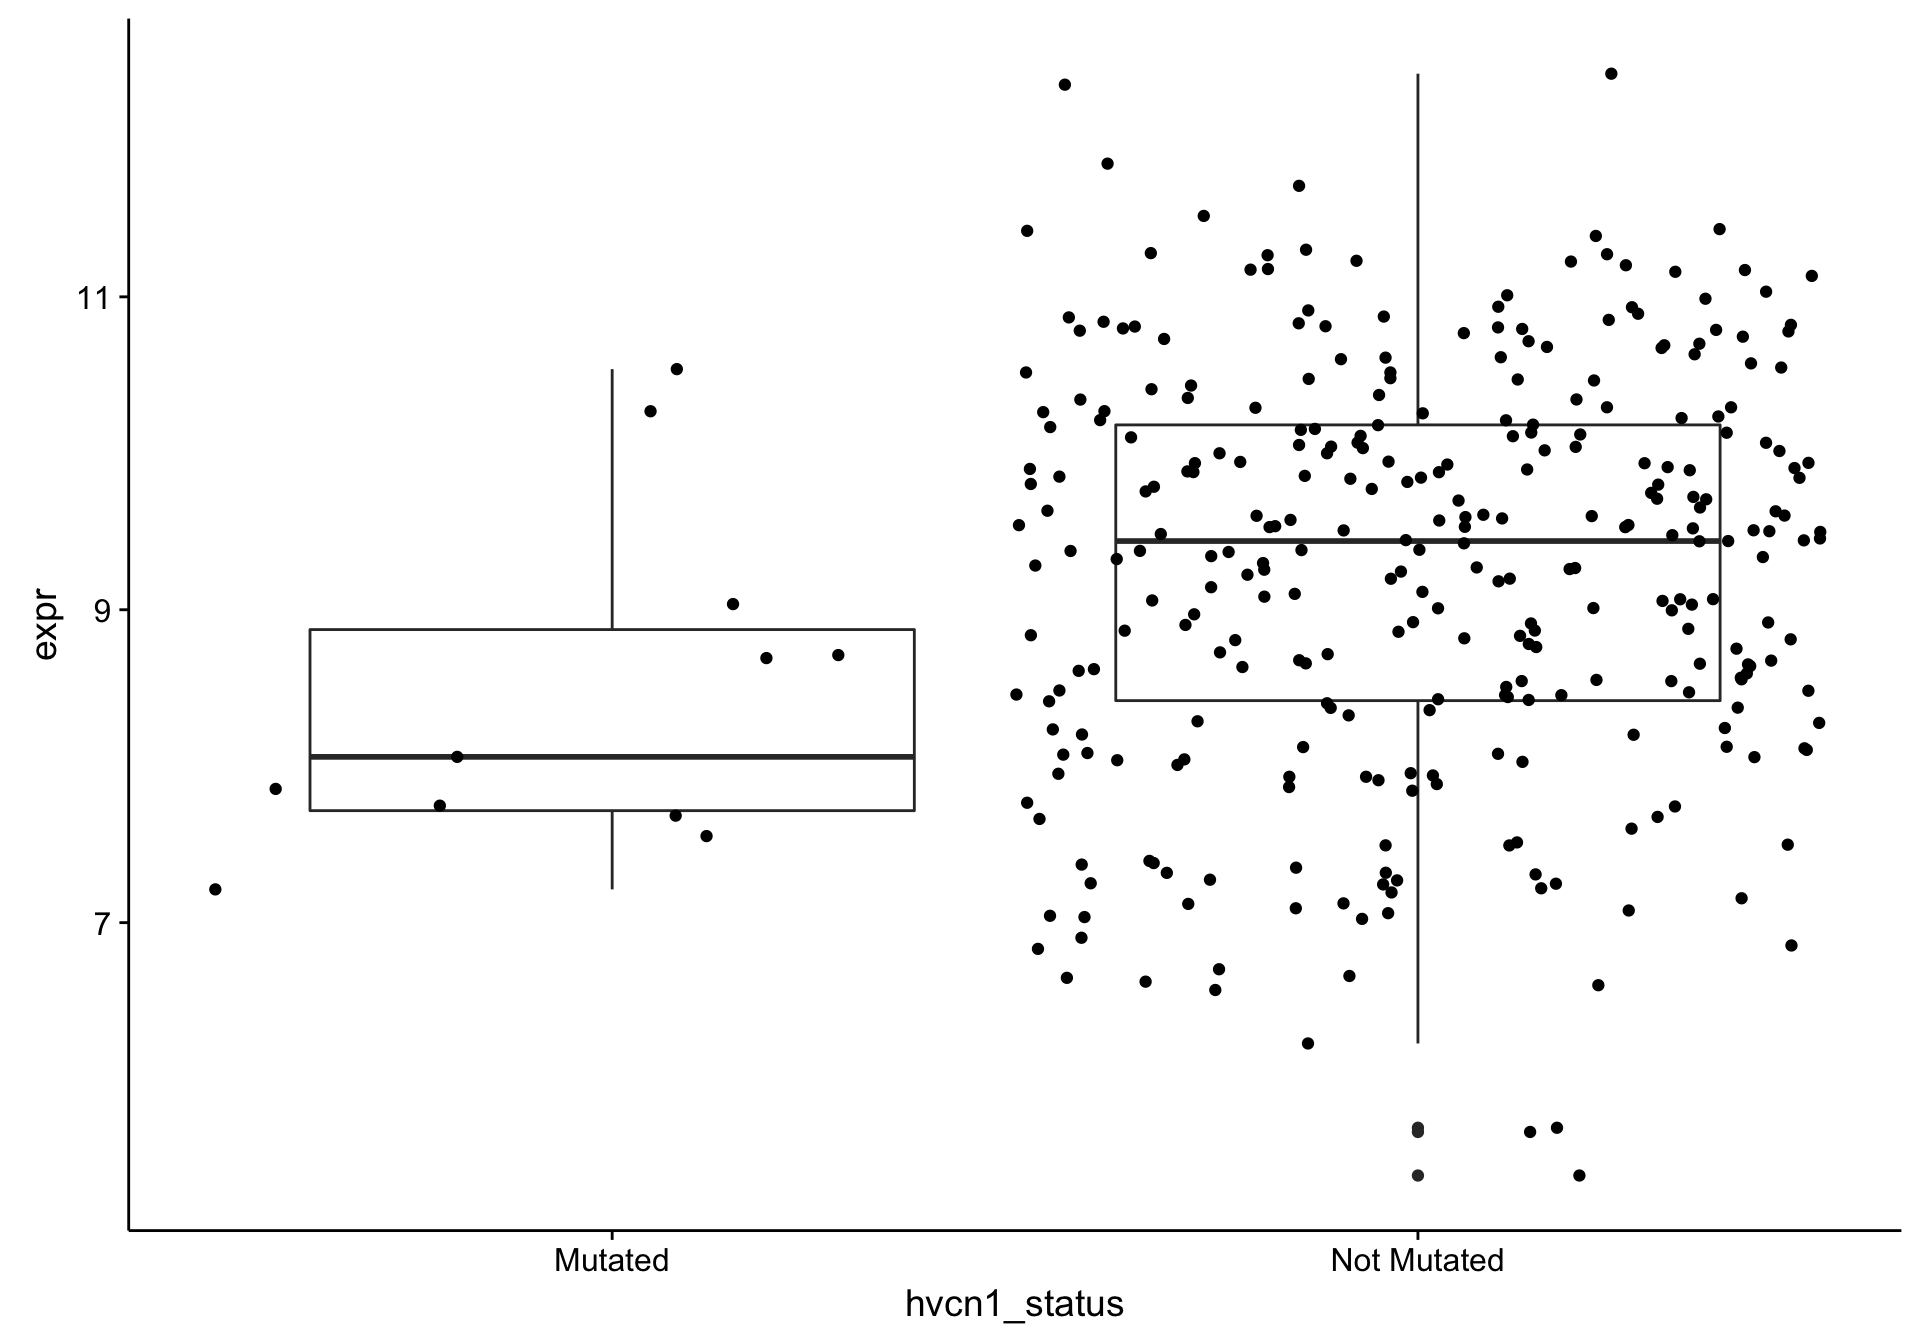
Across GCB DLBCL samples
texpr_hvcn1_gcb <-
  texpr_hvcn1_all %>%
  dplyr::left_join(coo, by = "patient") %>%
  dplyr::filter(coo_ns == "GCB")

boxplot_hvcn1_expr_gcb <-
  boxplot_hvcn1_expr_all %+% texpr_hvcn1_gcb
boxplot_hvcn1_expr_gcb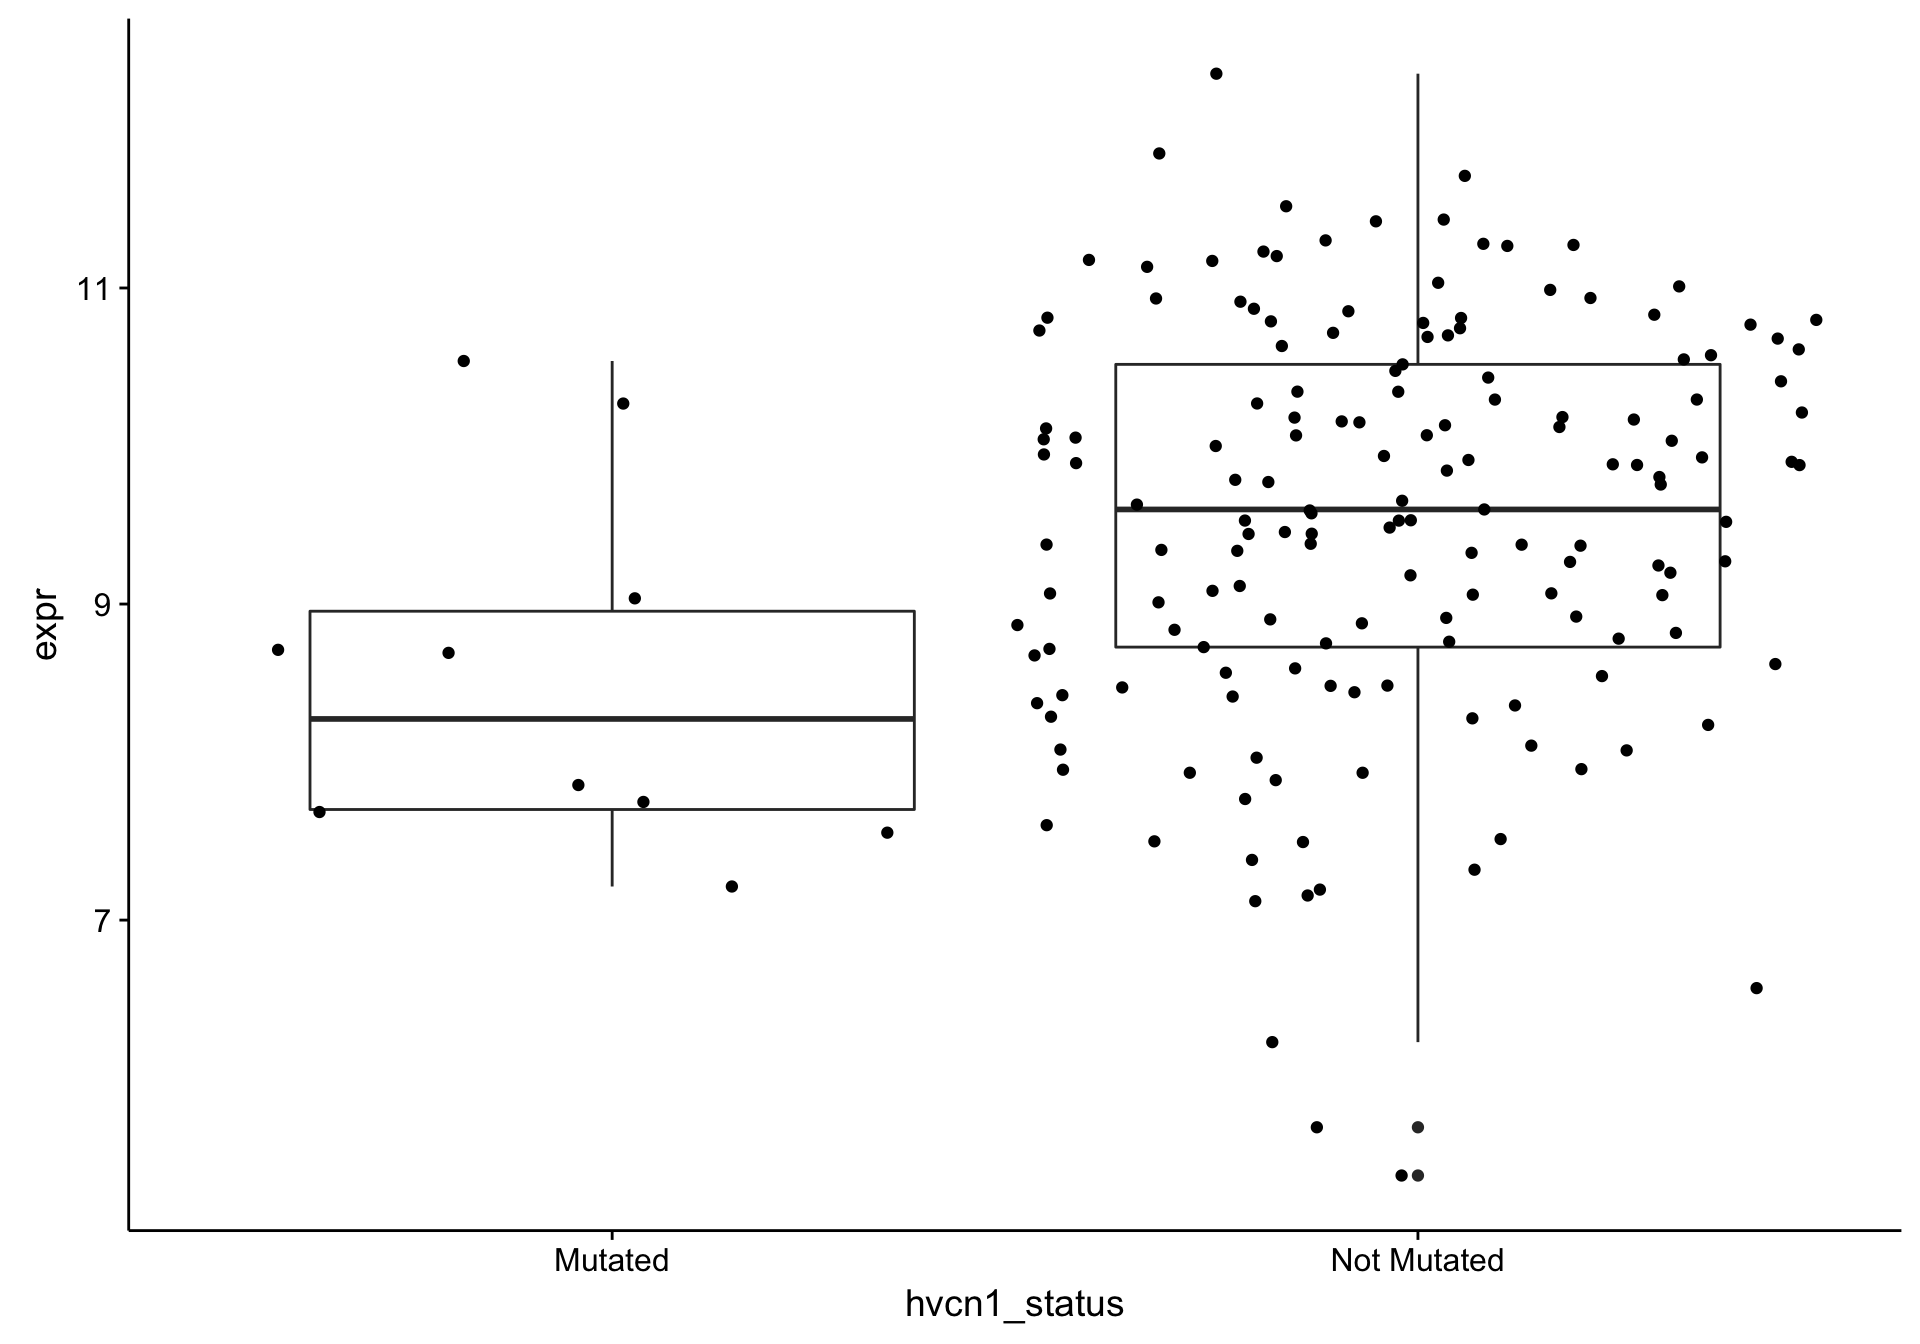
Mann-Whitney U test
Using all DLBCL samples
hvcn1_mutants <- texpr_hvcn1_all$patient %in% patients_hvcn1
wilcox.test(texpr_hvcn1_gcb[hvcn1_mutants, "expr"], texpr_hvcn1_gcb[!hvcn1_mutants, "expr"])
    Wilcoxon rank sum test with continuity correction

data:  texpr_hvcn1_gcb[hvcn1_mutants, "expr"] and texpr_hvcn1_gcb[!hvcn1_mutants, "expr"]
W = 730, p-value = 0.003934
alternative hypothesis: true location shift is not equal to 0
Using GCB DLBCL samples
hvcn1_mutants <- texpr_hvcn1_gcb$patient %in% patients_hvcn1
wilcox.test(texpr_hvcn1_gcb[hvcn1_mutants, "expr"], texpr_hvcn1_gcb[!hvcn1_mutants, "expr"])
    Wilcoxon rank sum test with continuity correction

data:  texpr_hvcn1_gcb[hvcn1_mutants, "expr"] and texpr_hvcn1_gcb[!hvcn1_mutants, "expr"]
W = 422, p-value = 0.0118
alternative hypothesis: true location shift is not equal to 0