Unsupervised Clustering
Bruno Grande
2017-03-02
Batch Effect Correction
To investigate unsupervised clustering, we will perform batch effect correction based on the variables defined on the Salmon QC page. Specifically, we correct the variance-stabilized expression values using sex, SV1, SV2 and SV3 as batch variables.
cov_matrix <- as.matrix(colData(salmon$clean$dds)[,c("SV1", "SV2", "SV3")])

salmon$clean$cvst <-
  limma::removeBatchEffect(
    assay(salmon$clean$vst),
    colData(salmon$clean$dds)$sex,
    covariates = cov_matrix) %>%
  SummarizedExperiment(colData = colData(salmon$clean$vst))
Hierarchical Clustering
We plot the expression of the 1000 most variably expressed genes before and after correction as heatmaps below to verify that batch effects have indeed been corrected.
Original Expression Values
heatmap_clean_vst_most_var  <-
  plot_heatmap(most_var(salmon$clean$vst, ntop), colours)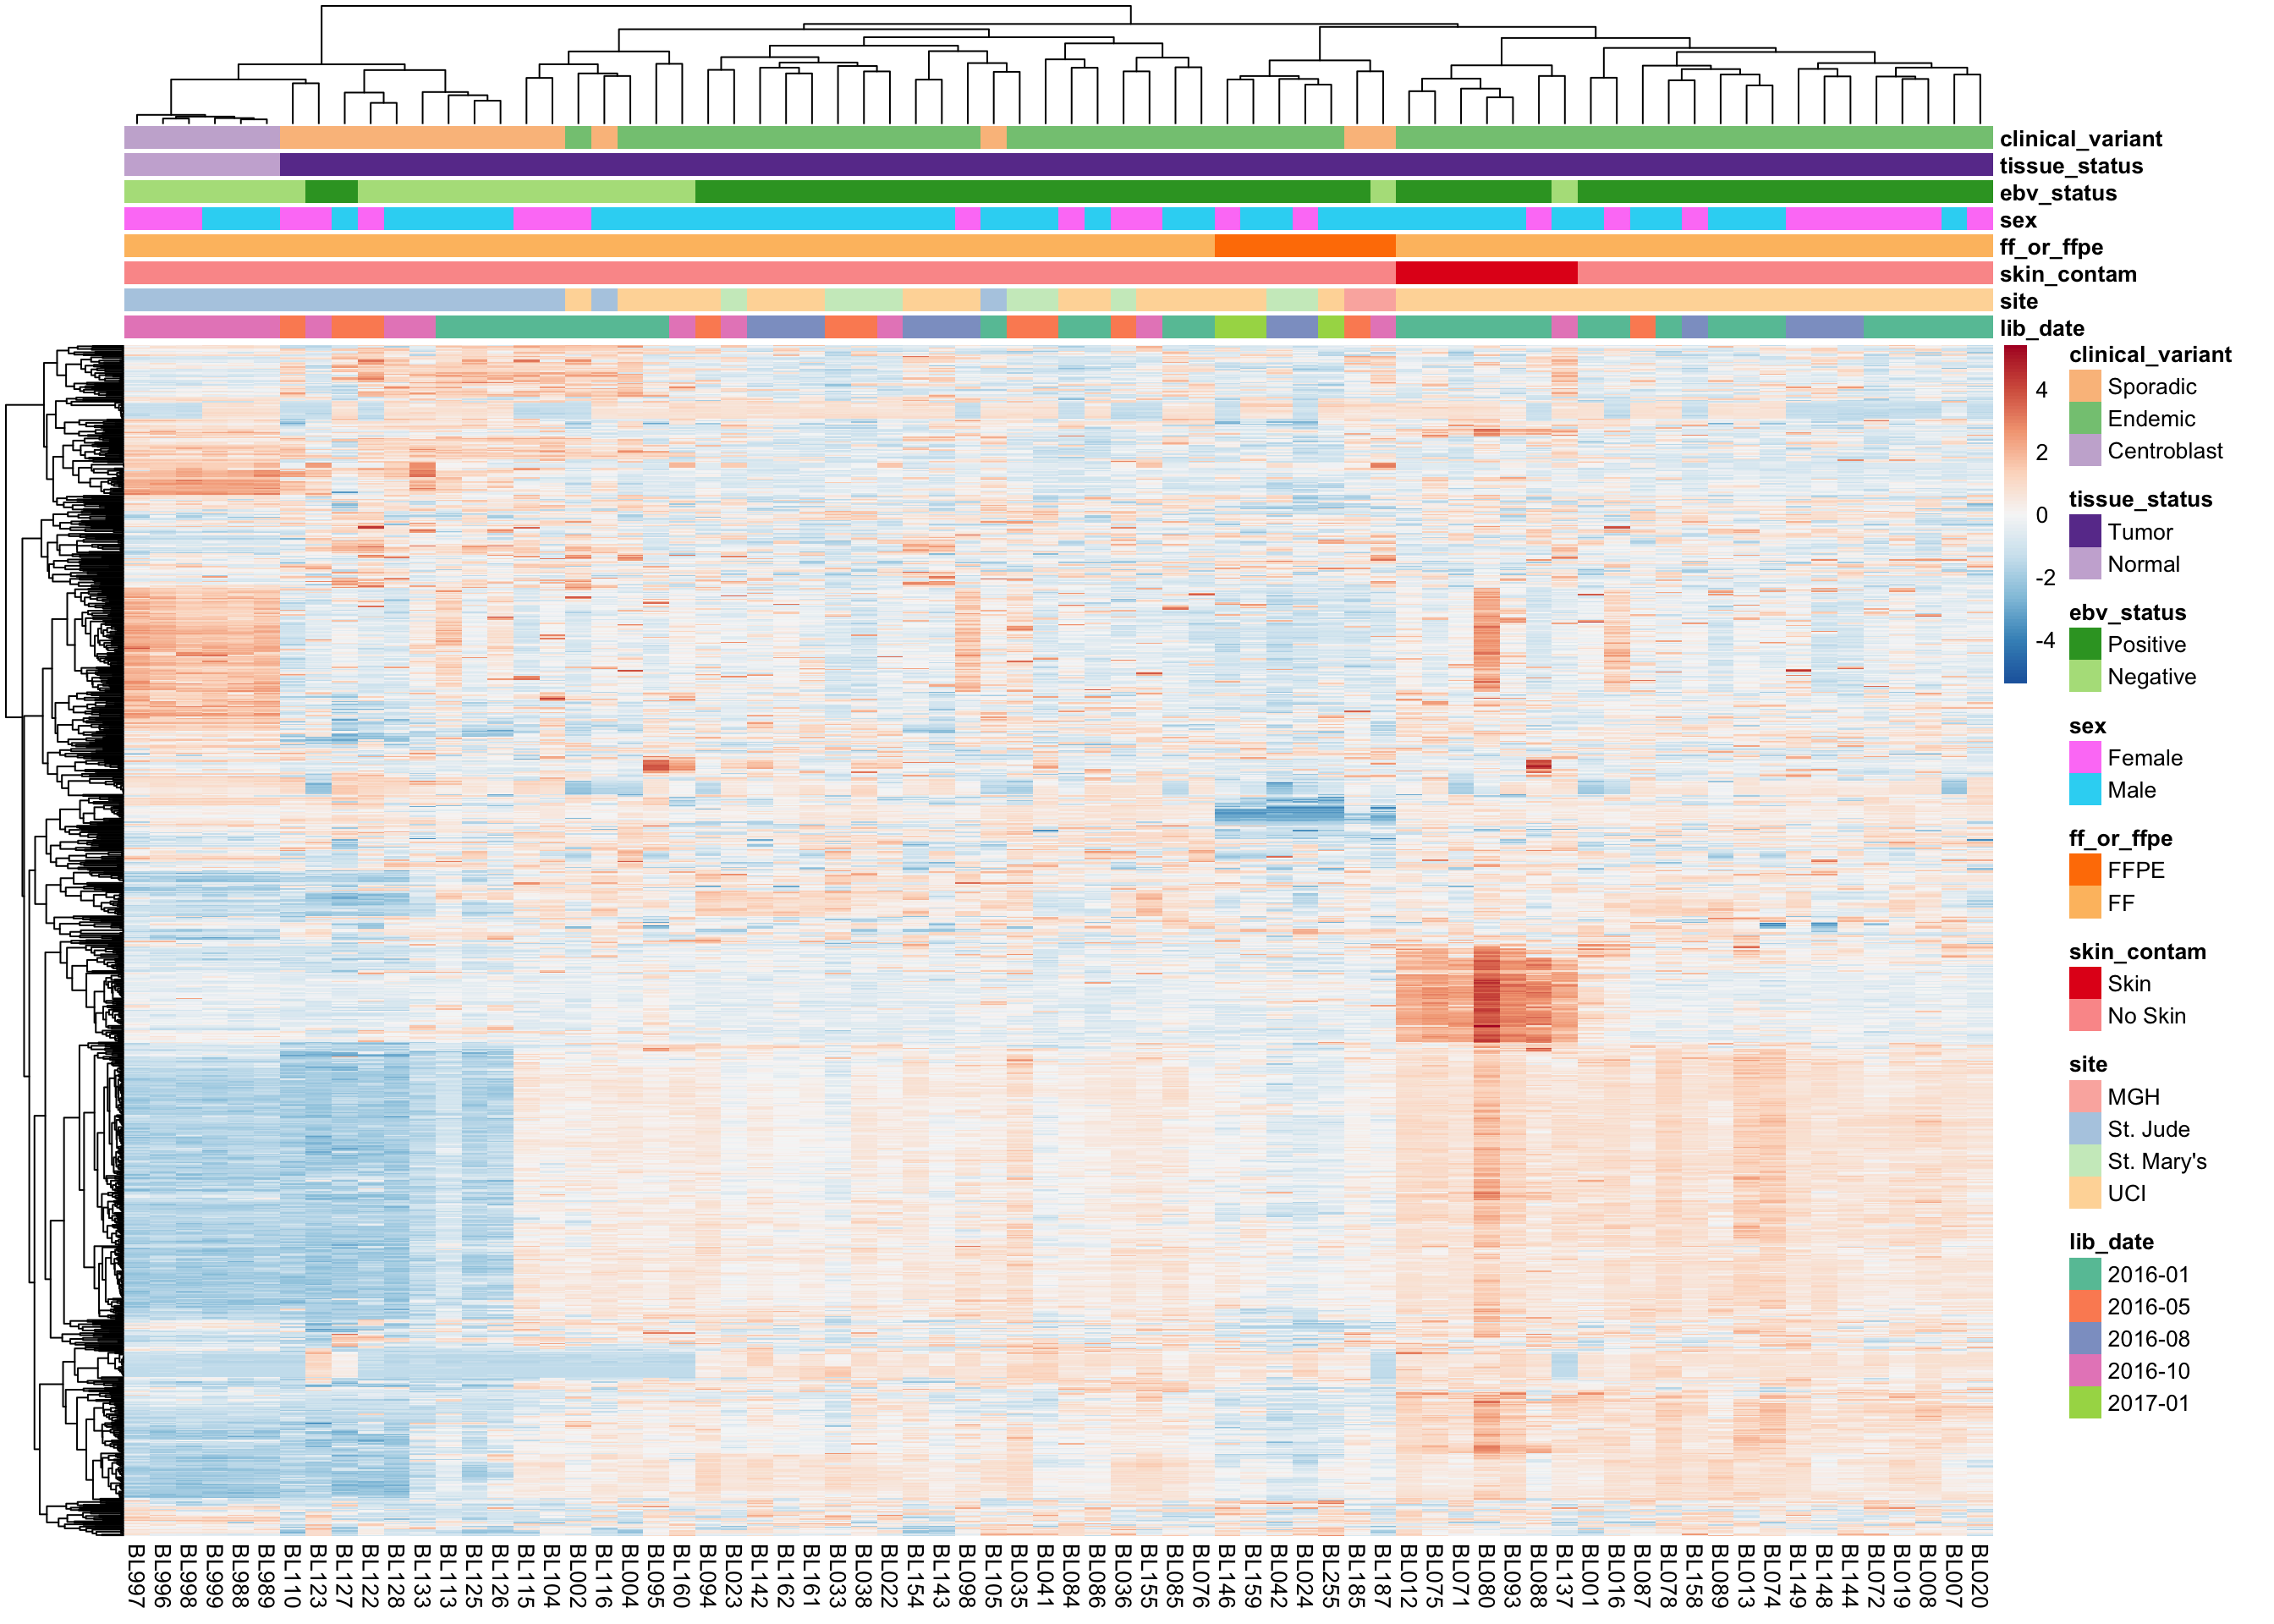
Corrected Expression Values
heatmap_clean_cvst_most_var <-
  plot_heatmap(most_var(salmon$clean$cvst, ntop), colours)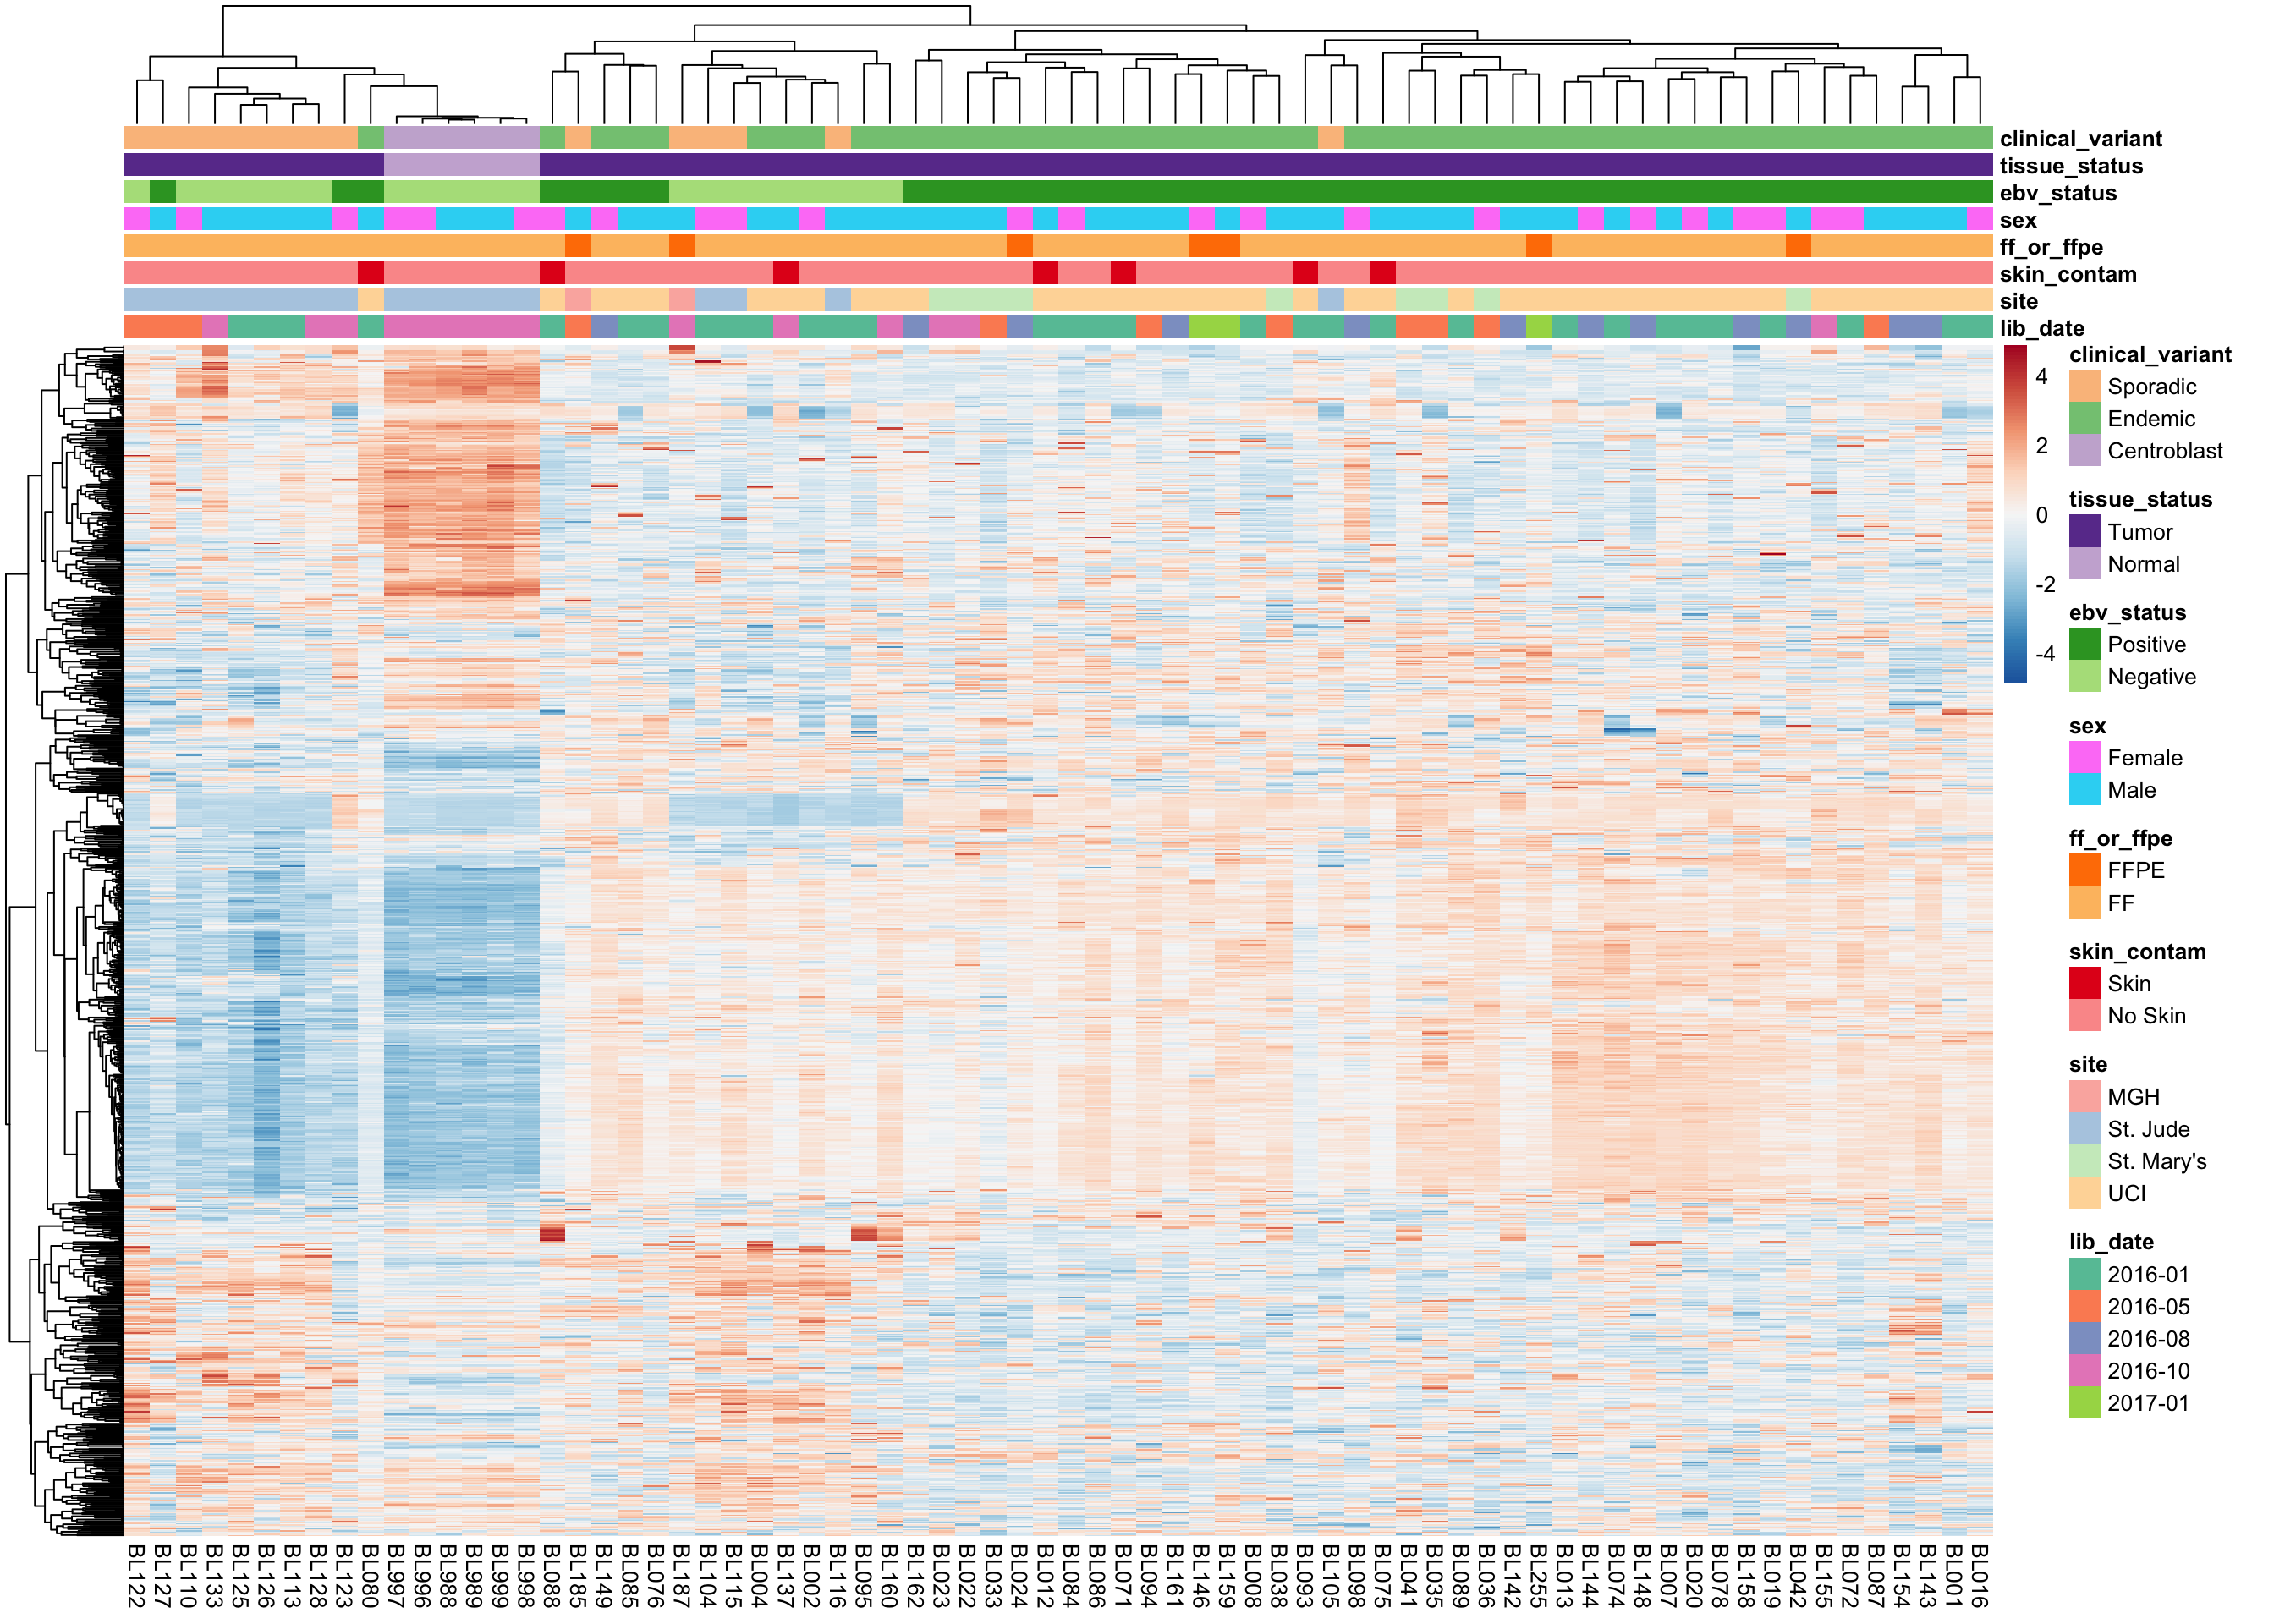
Sample Correlations
salmon$clean$cor <- cor(assay(salmon$clean$cvst))

corplot_salmon_clean <- plot_heatmap(
  salmon$clean$cor, colours, colData(salmon$clean$dds), scale = "none",
  treeheight_row = 0)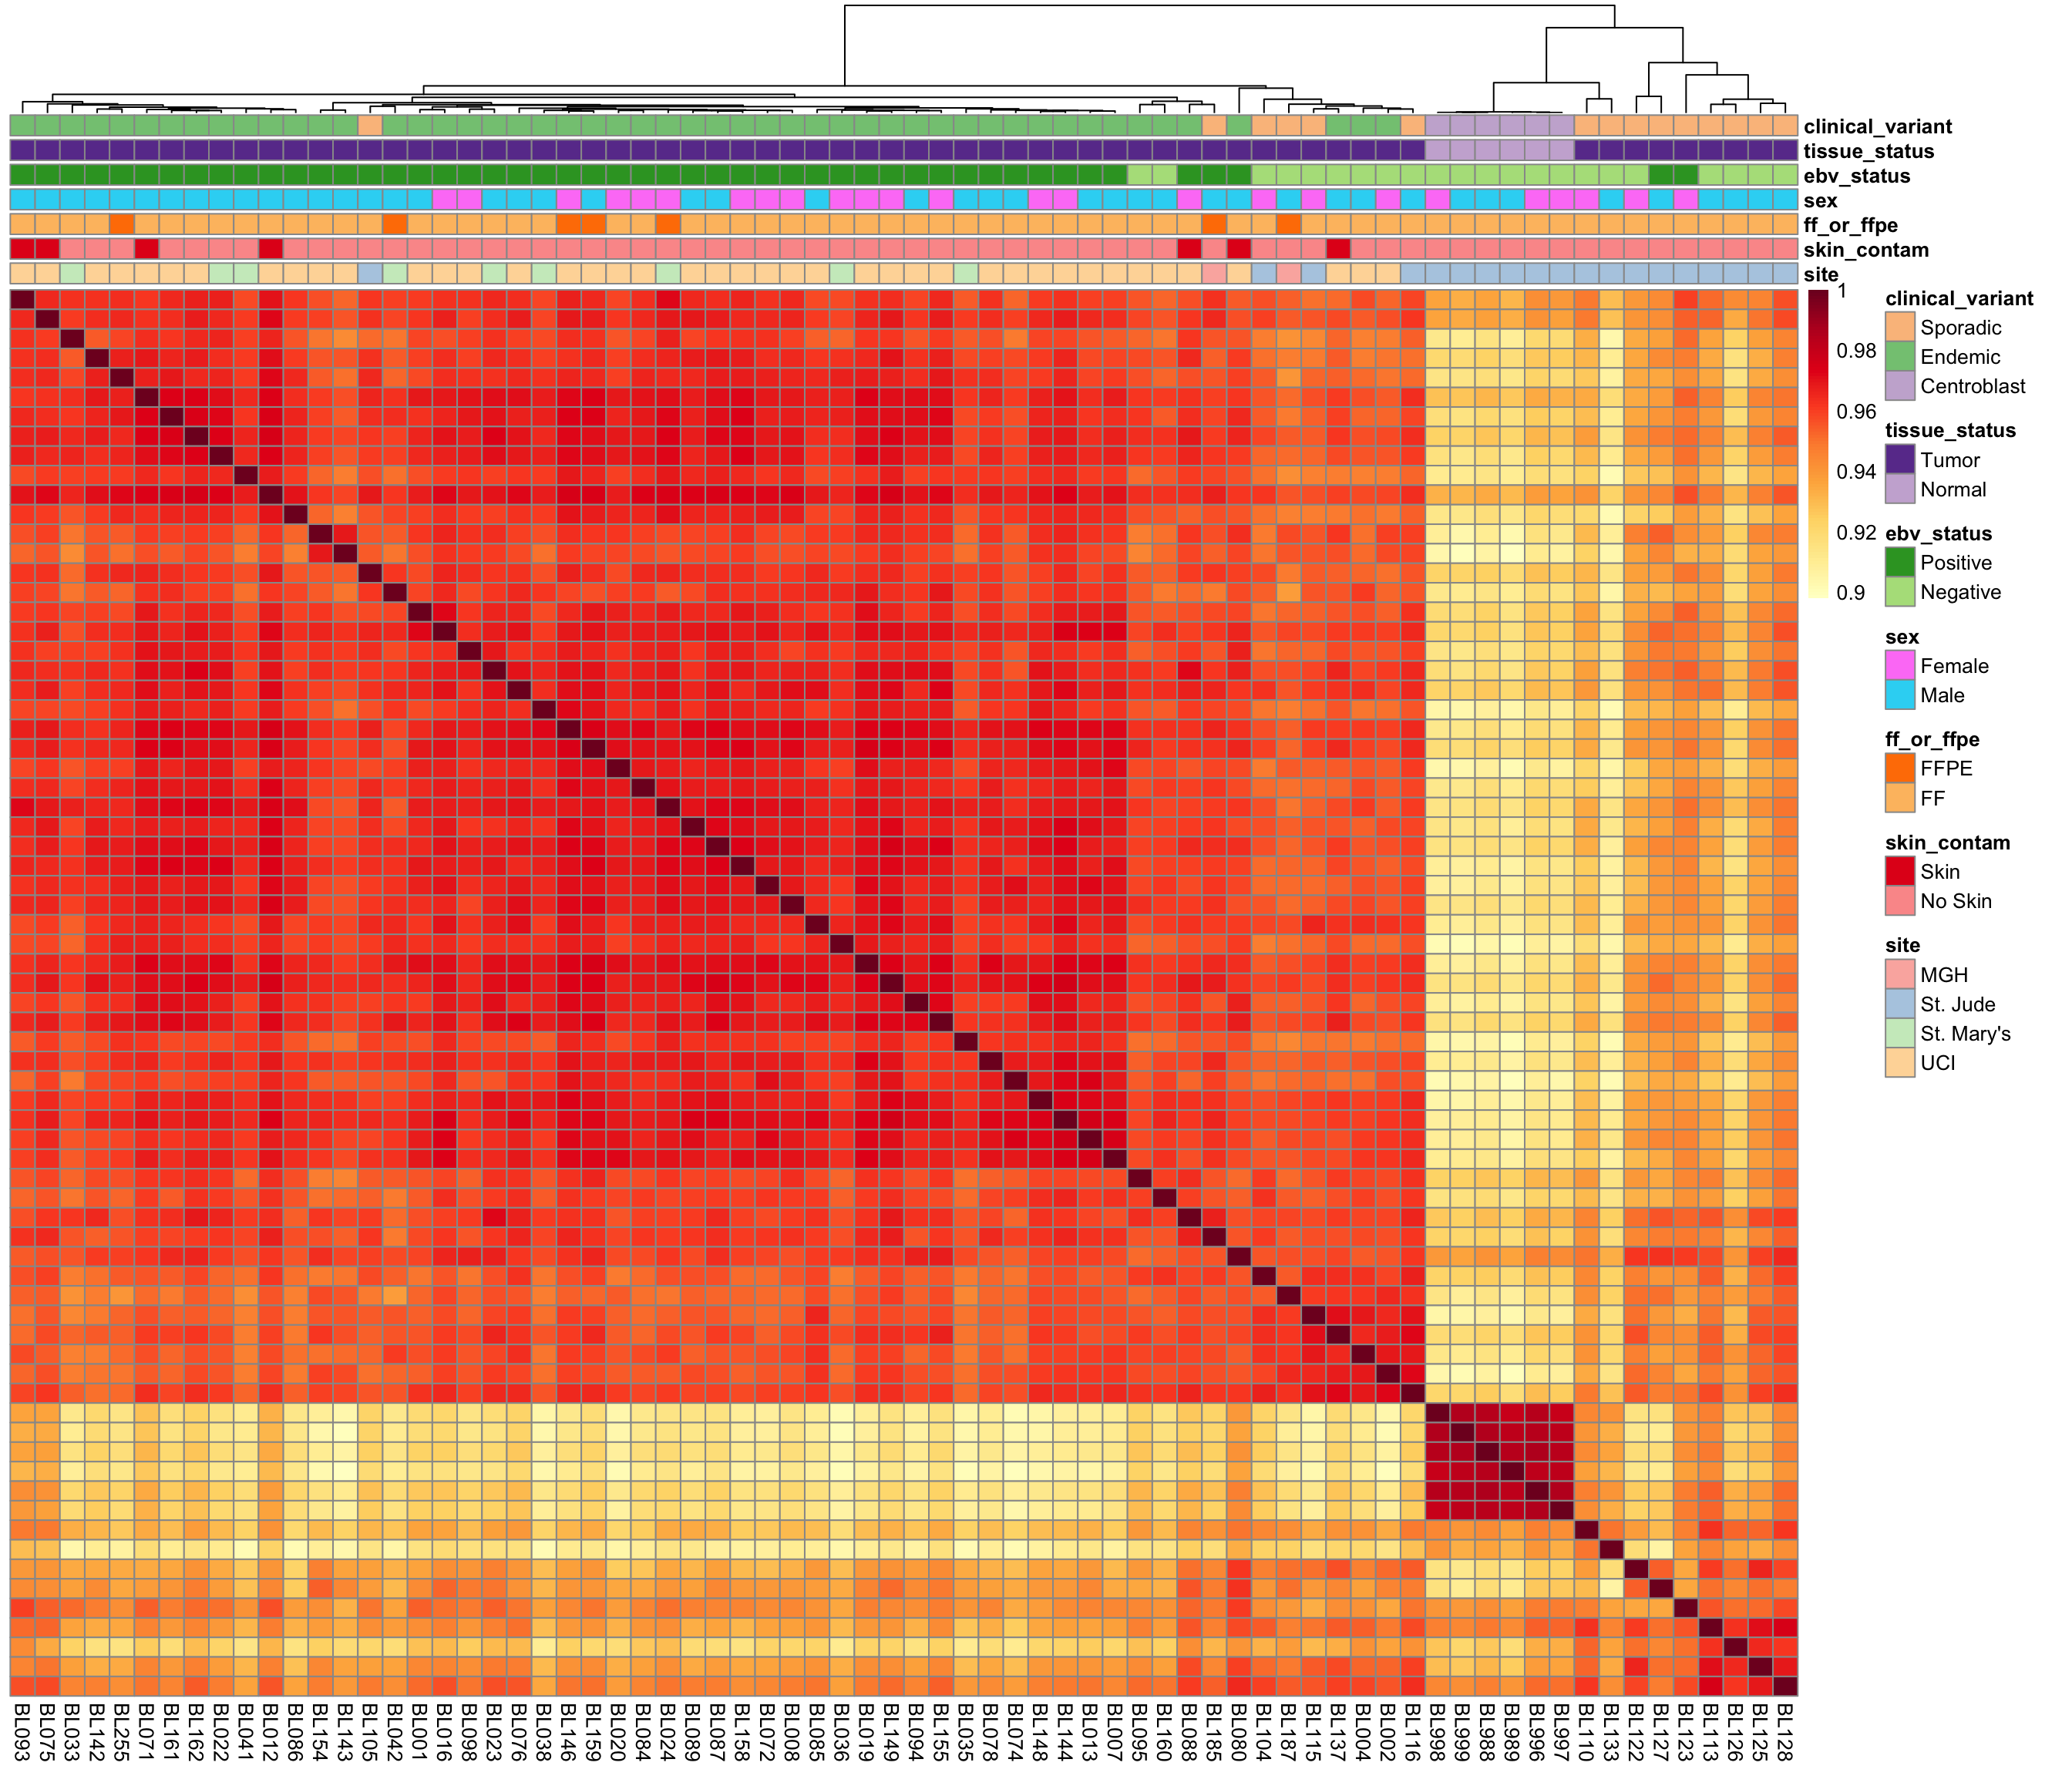
Principal Component Analysis
salmon$clean$pca <- calc_pca(salmon$clean$cvst)

pca_salmon_clean_plots <-
  names(colData(salmon$clean$dds)) %>%
  stringr::str_subset("^(?!SV)") %>%
  map(~plot_pca(salmon$clean$pca, .x, colours, c(1,1)))

screeplot_salmon <-
  salmon$clean$pca$percent_var %>%
  slice(1:10) %>%
  ggplot(aes(x = pc, y = percent_var, group = "all")) +
  geom_point() +
  geom_line() +
  labs(title = "PCA Scree Plot")

pca_salmon_clean_plots <- c(pca_salmon_clean_plots, list(screeplot_salmon))

gridExtra::grid.arrange(grobs = pca_salmon_clean_plots, ncol = 3)
mBL signature genes
heatmap_salmon_clean_mbl <-
  plot_heatmap(salmon$clean$cvst[geneids$mbl, ], colours)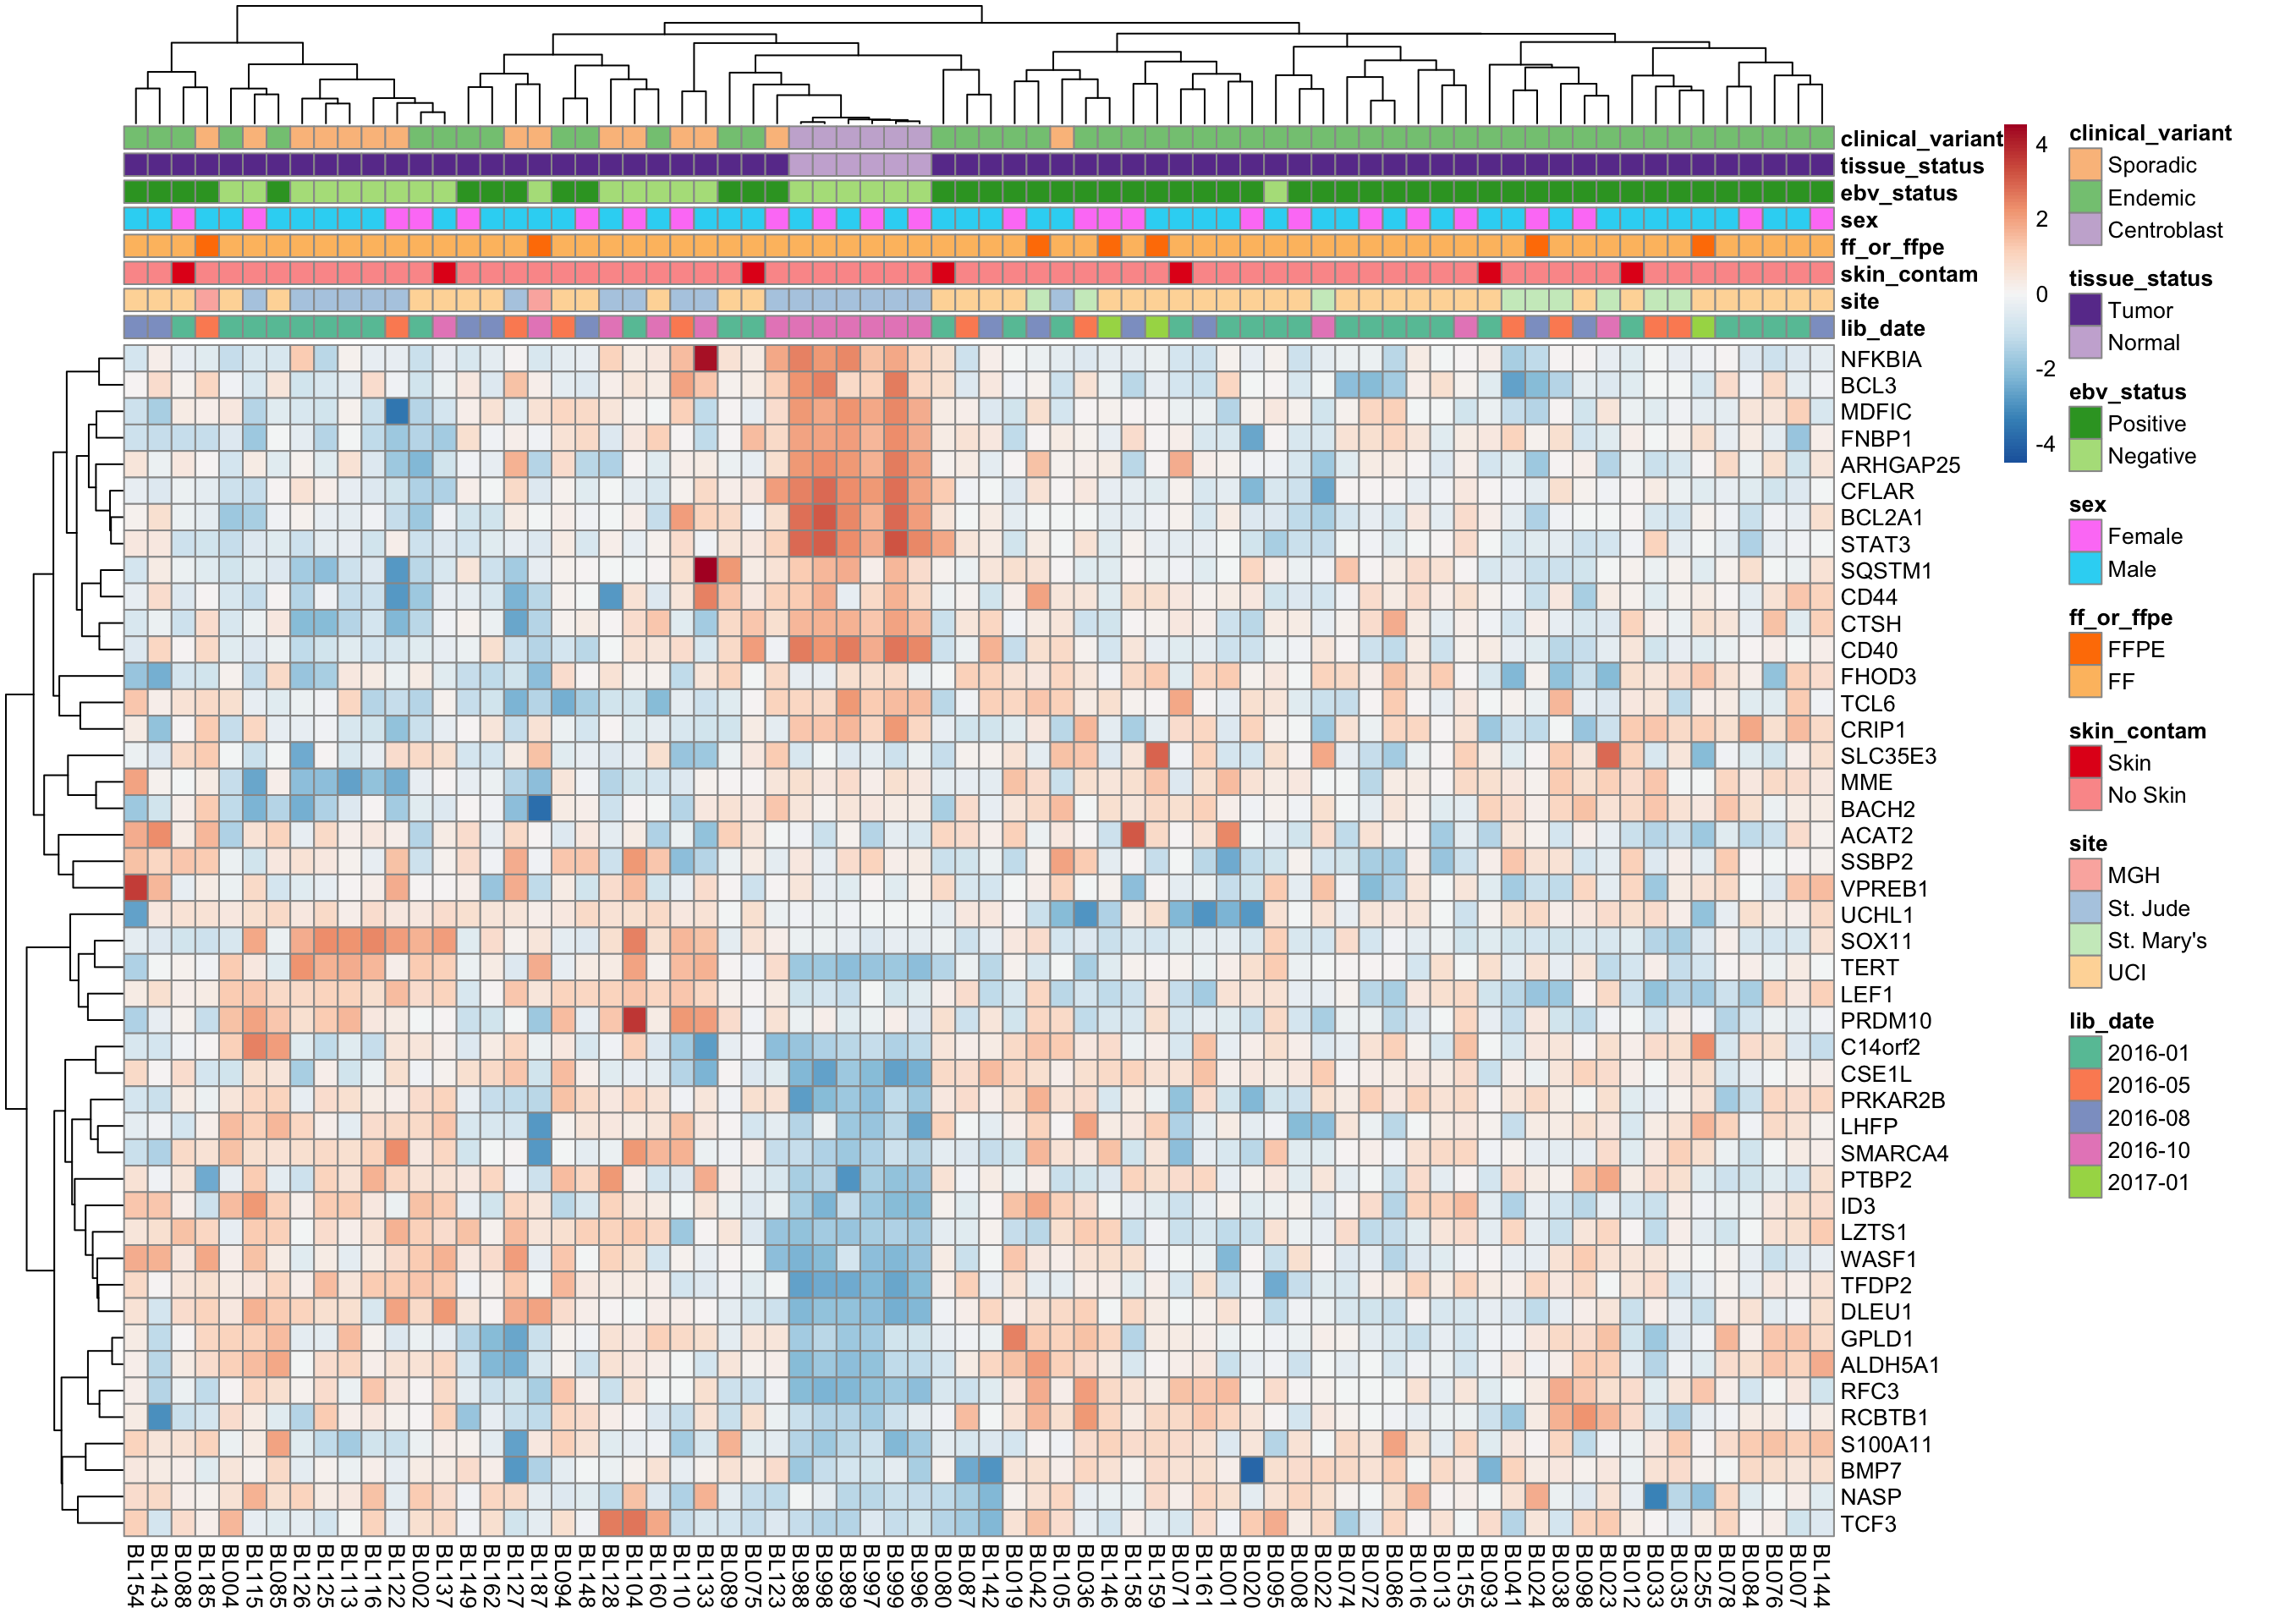
Morgan BL-DLBCL classifier
heatmap_salmon_clean_morgan <-
  plot_heatmap(salmon$clean$cvst[geneids$morgan, ], colours)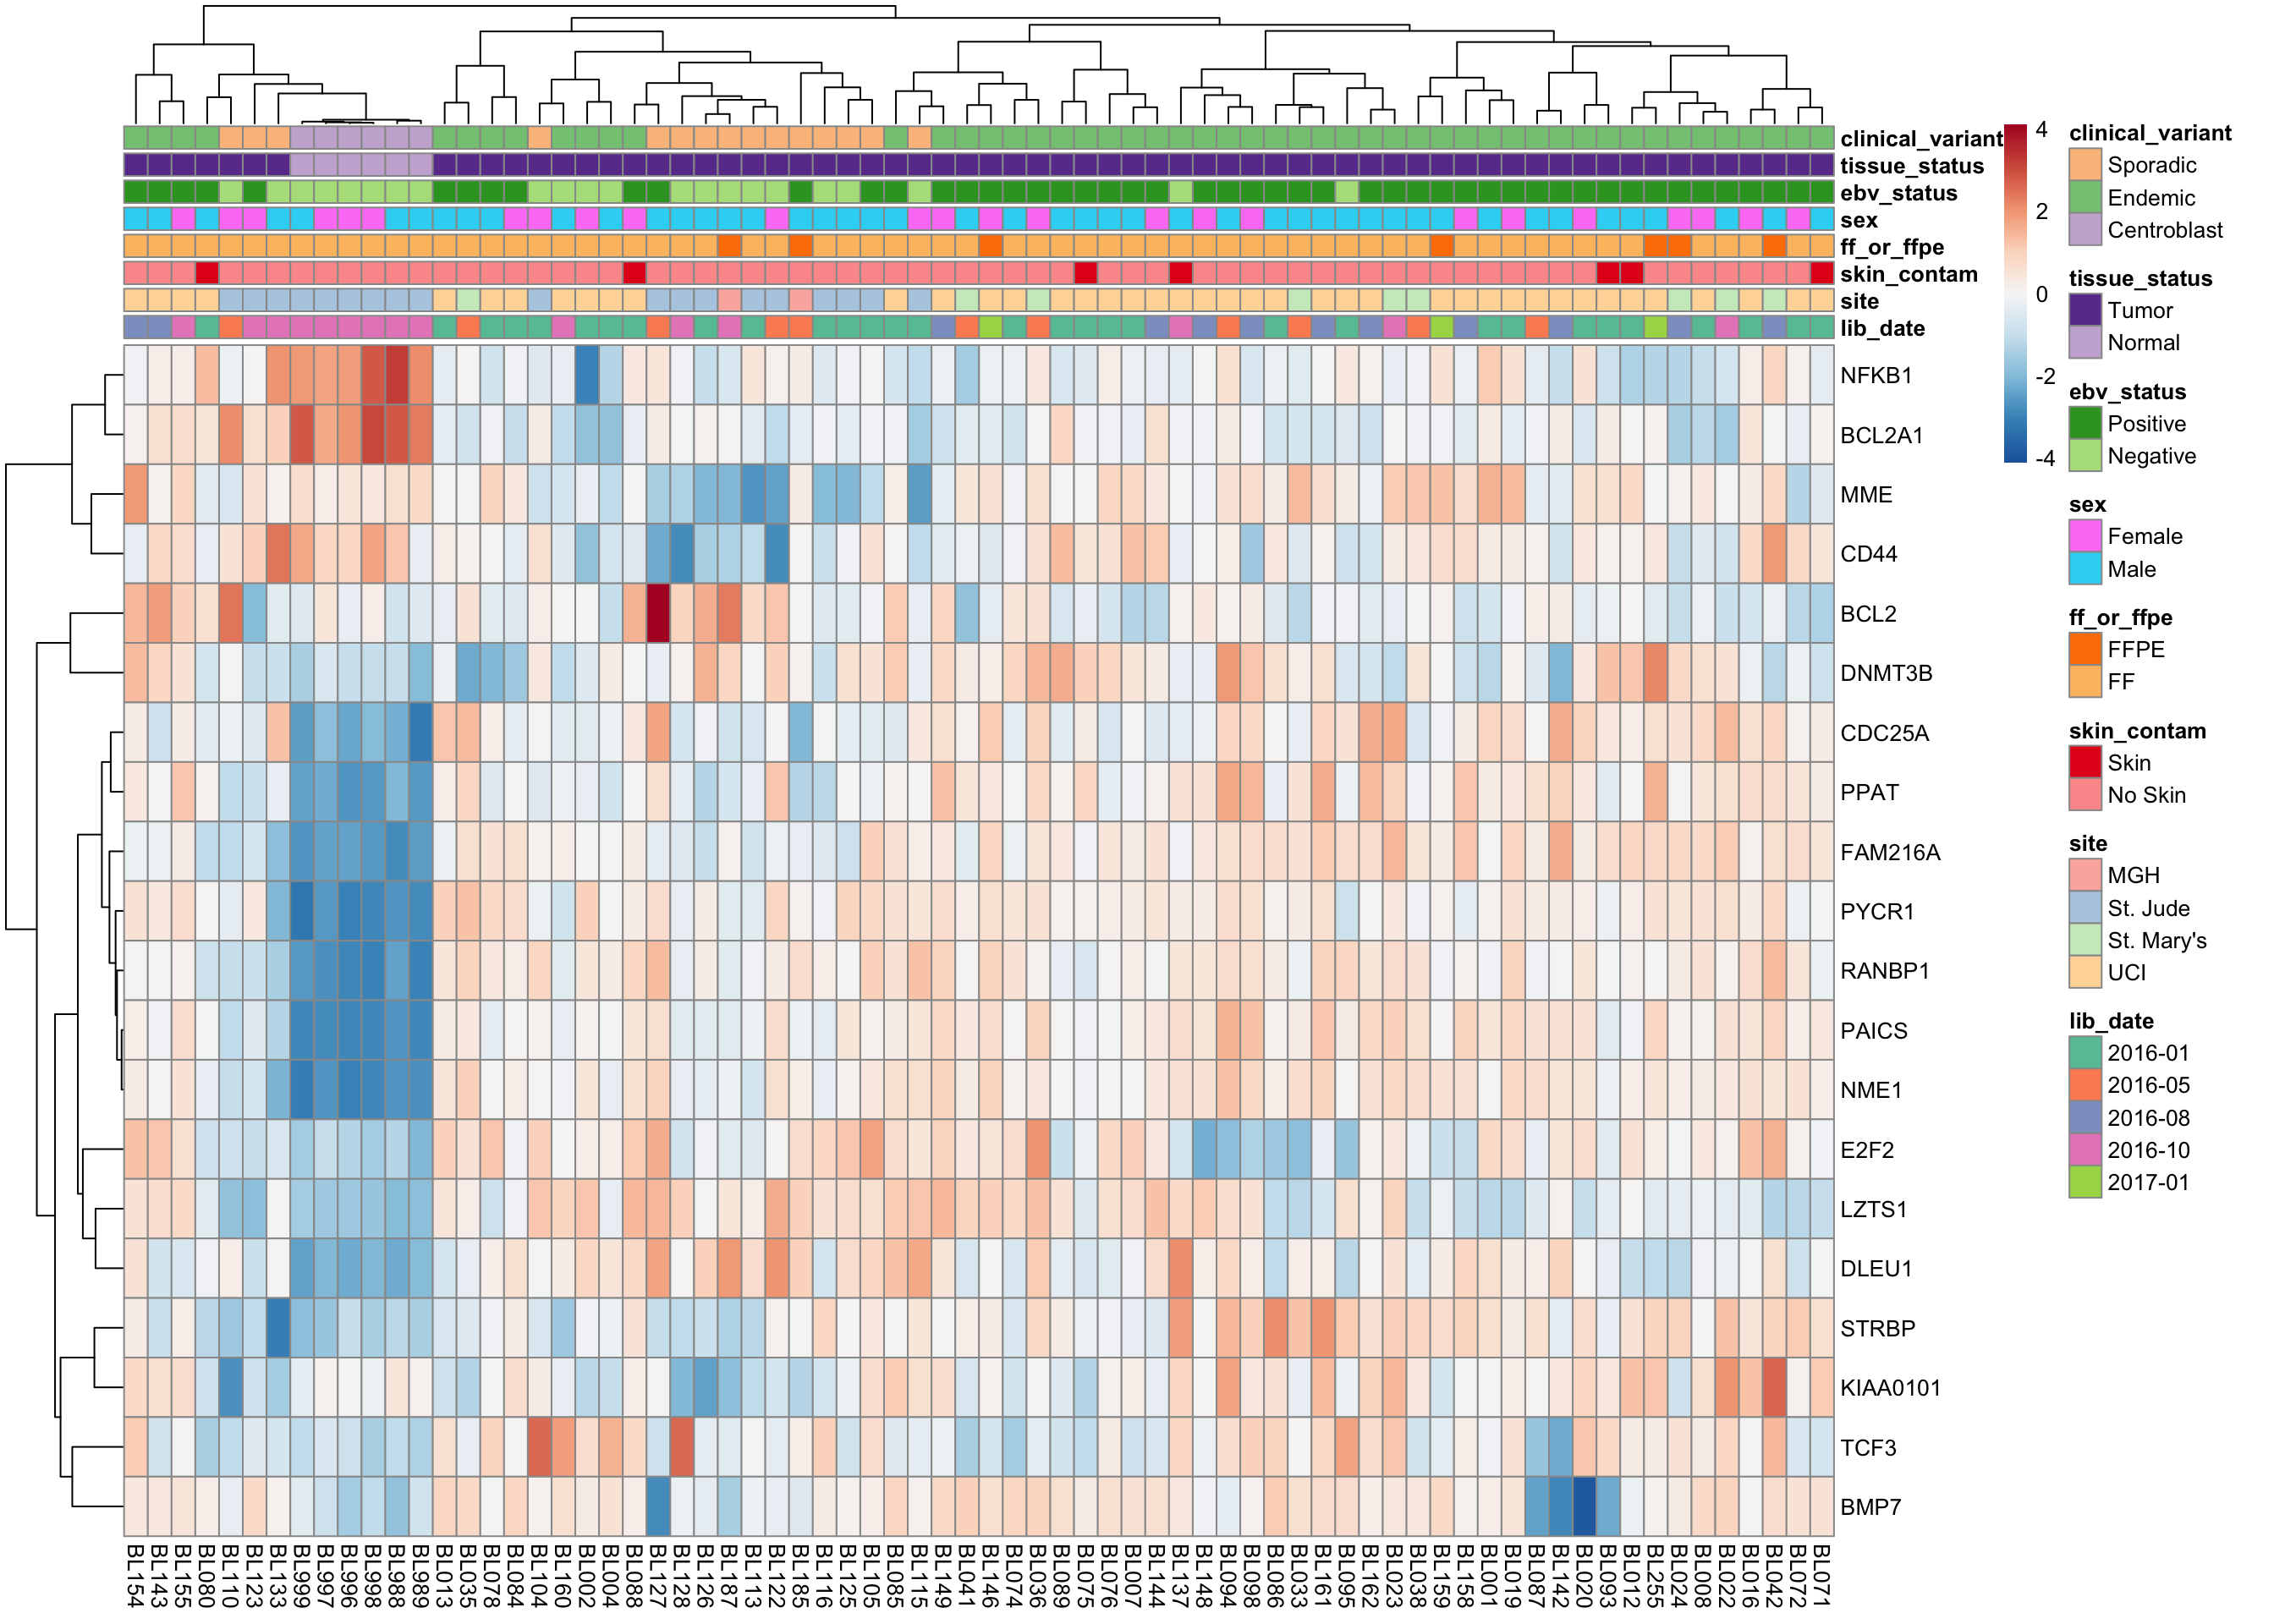
Wright COO classifier
heatmap_salmon_clean_wright <-
    plot_heatmap(salmon$clean$cvst[geneids$wright, ], colours)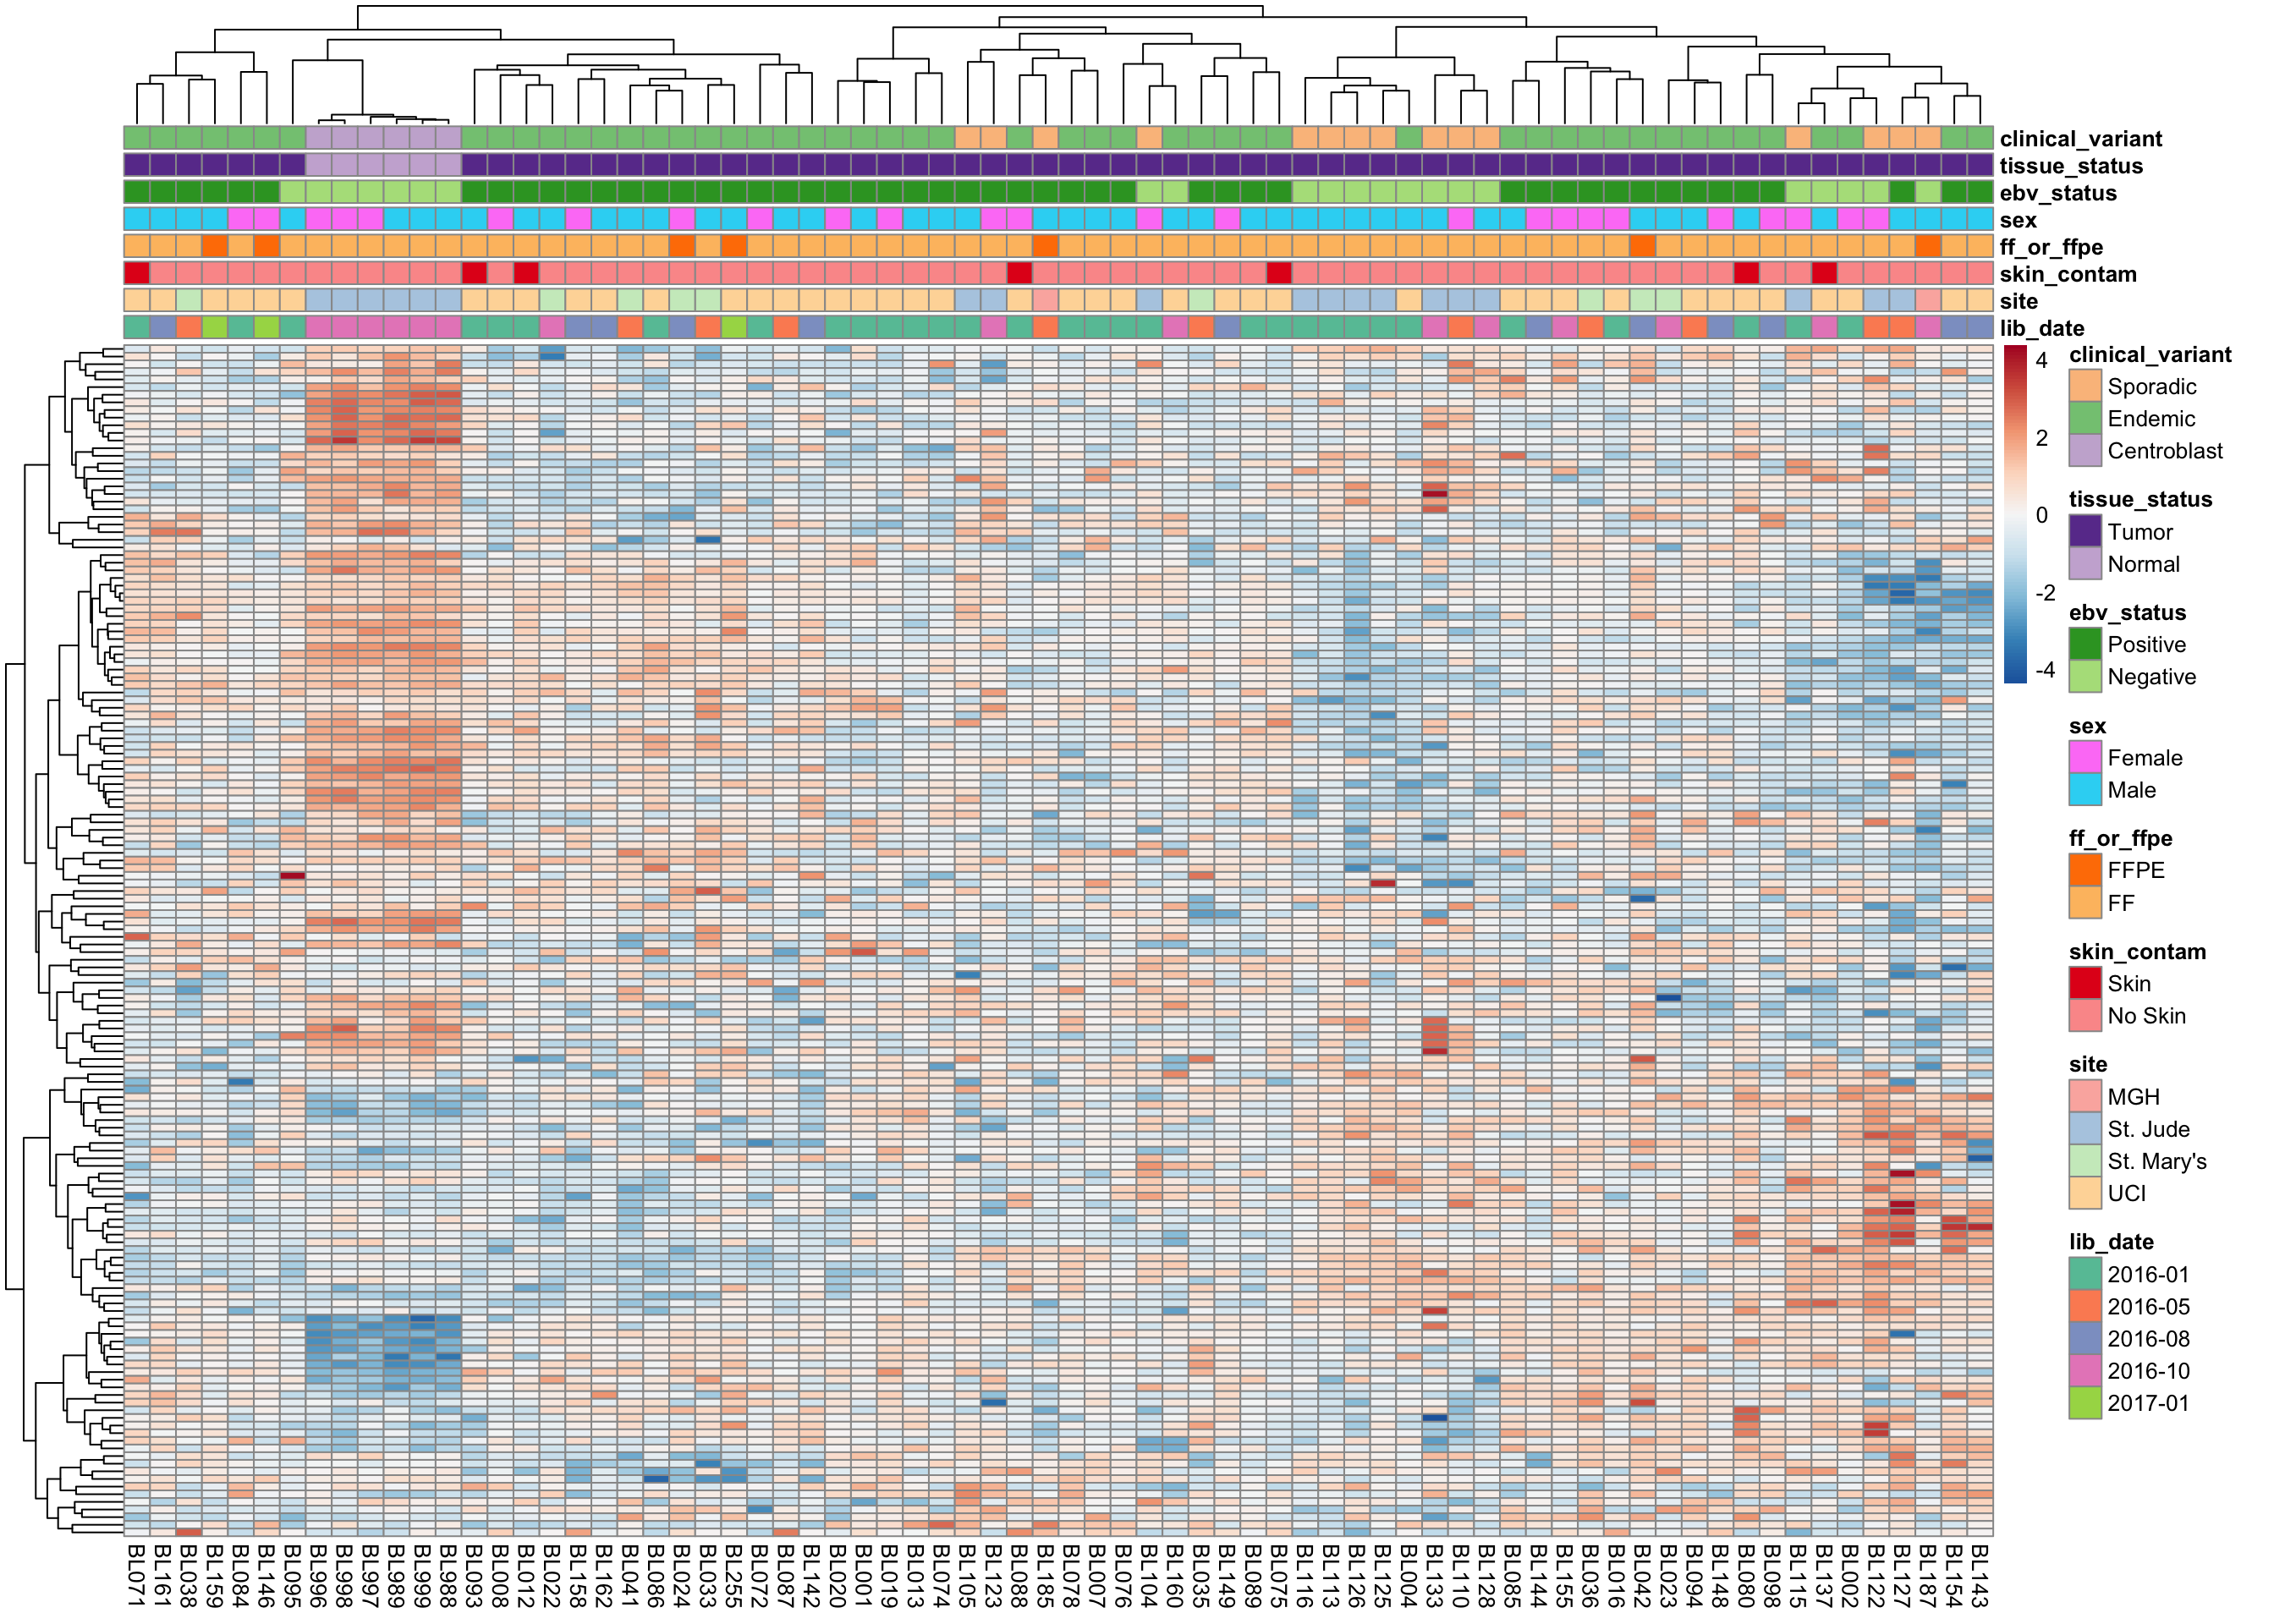
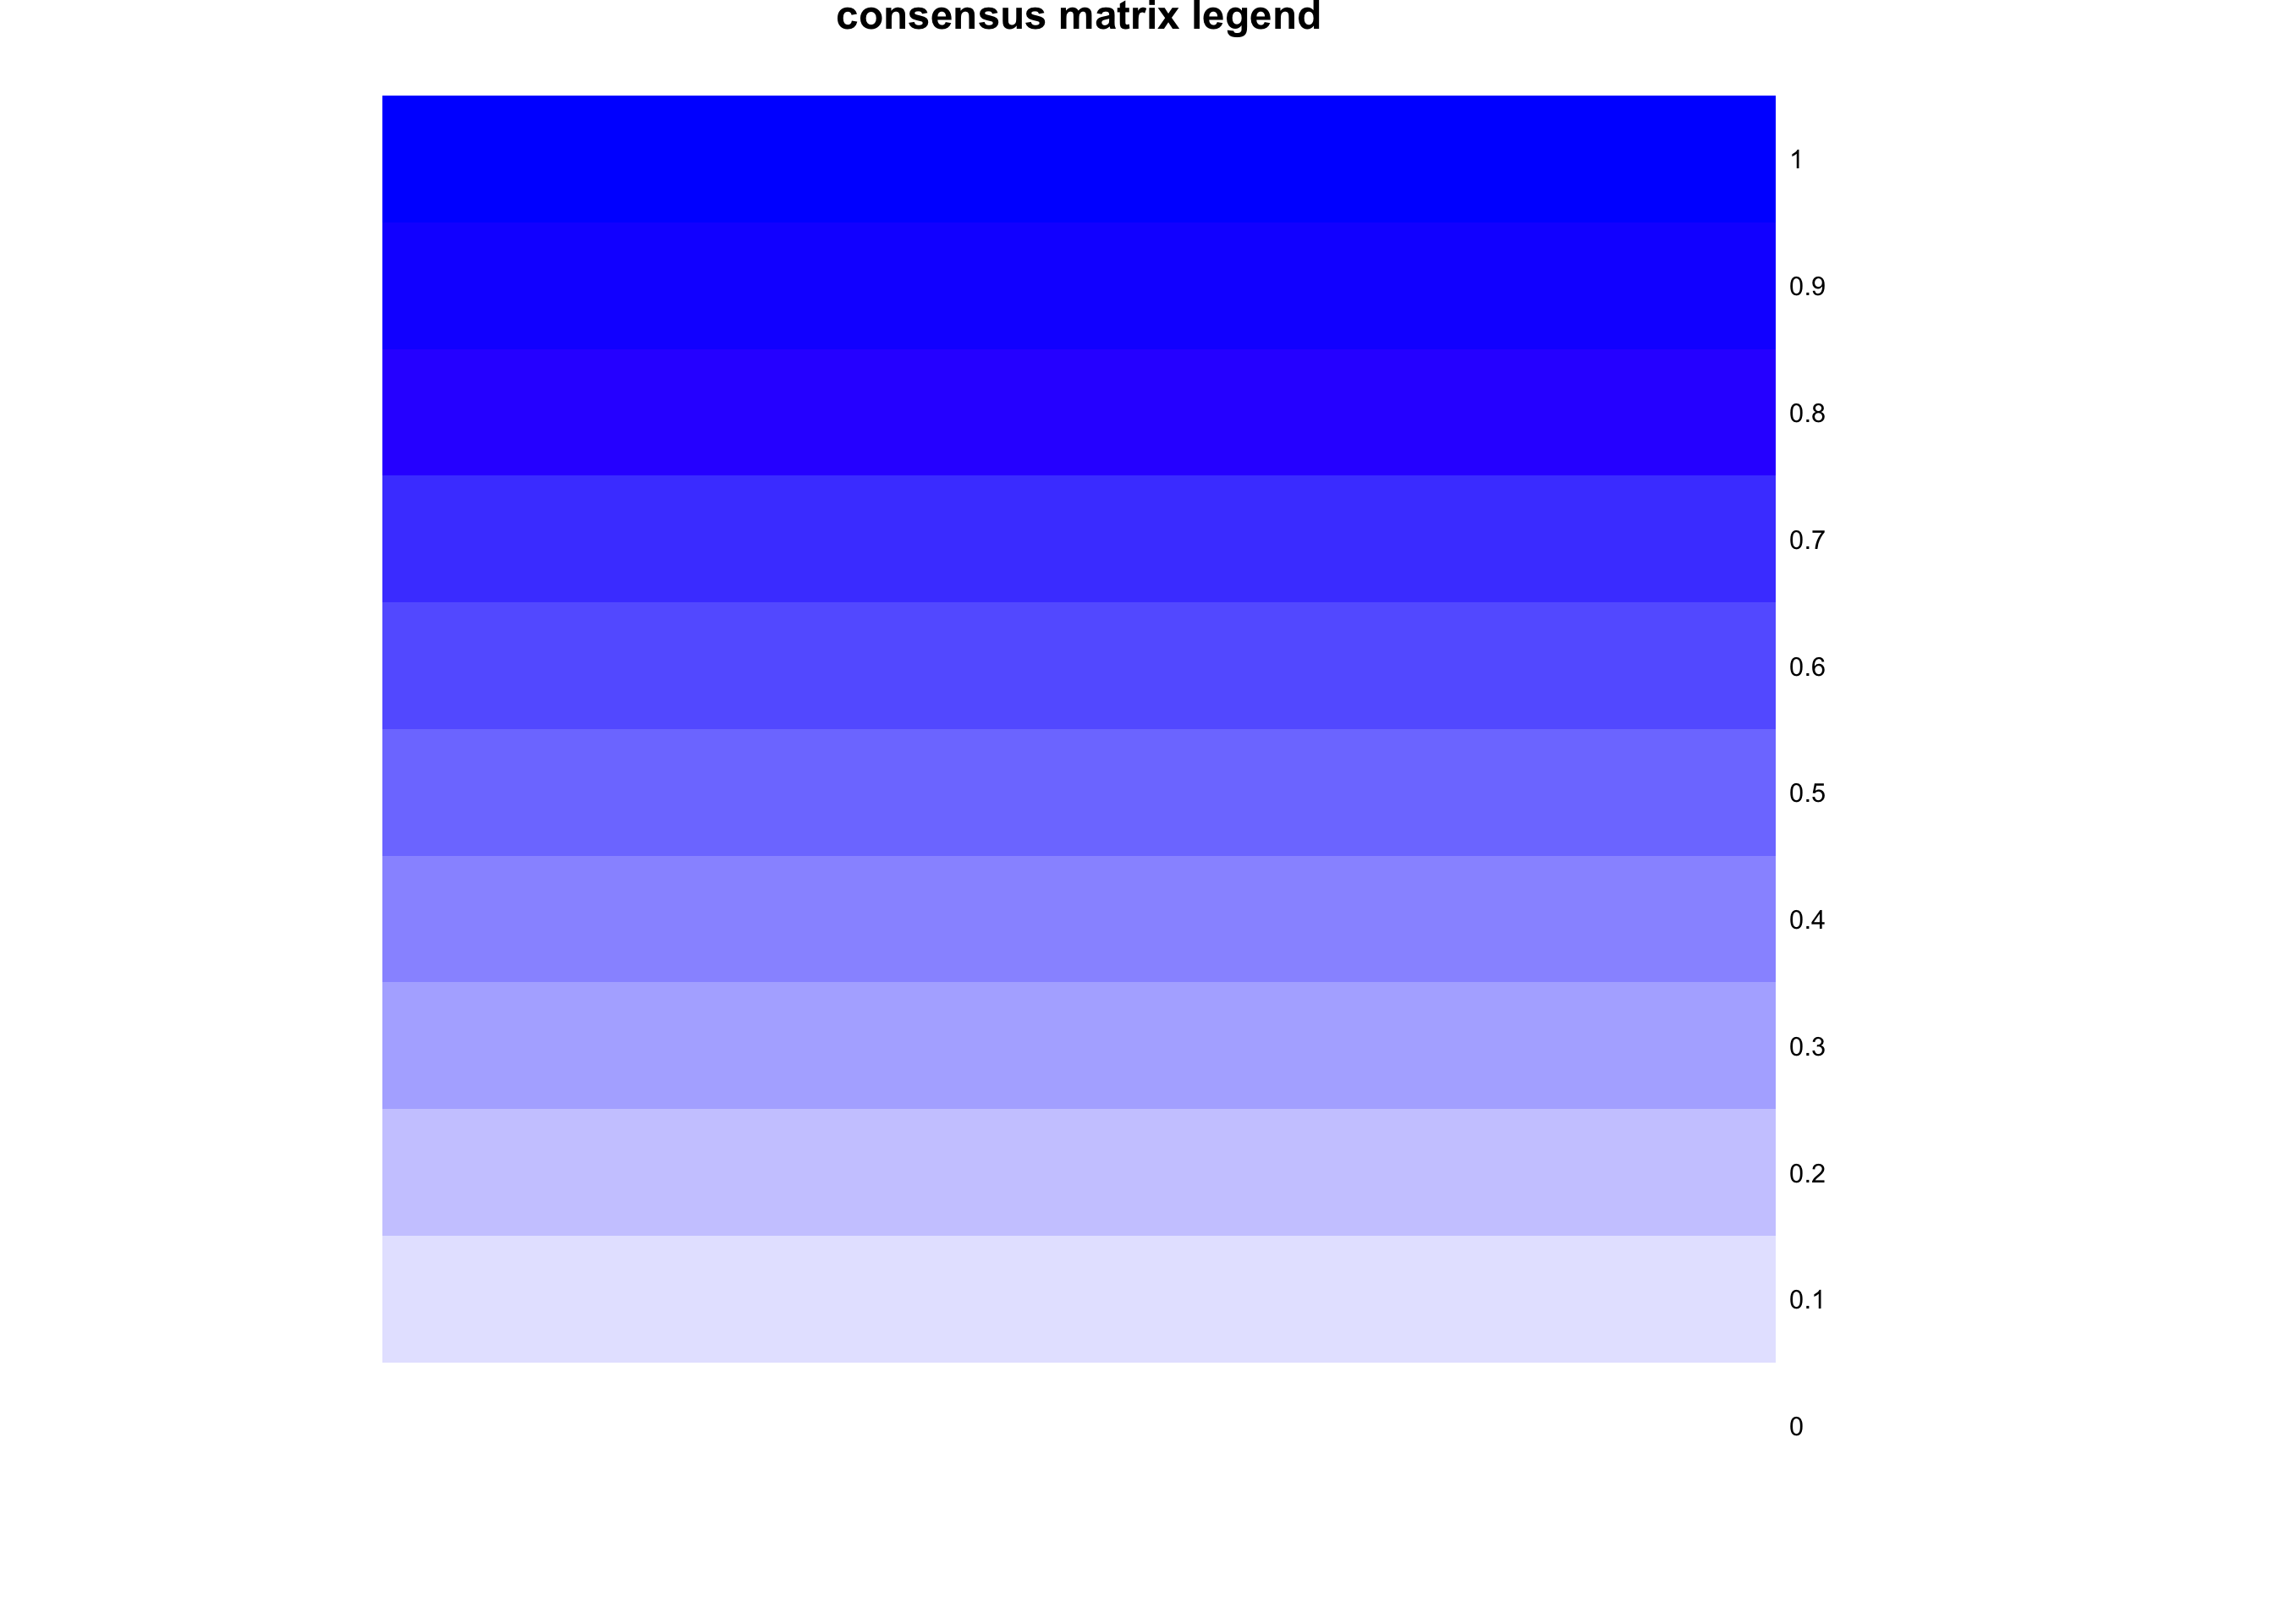
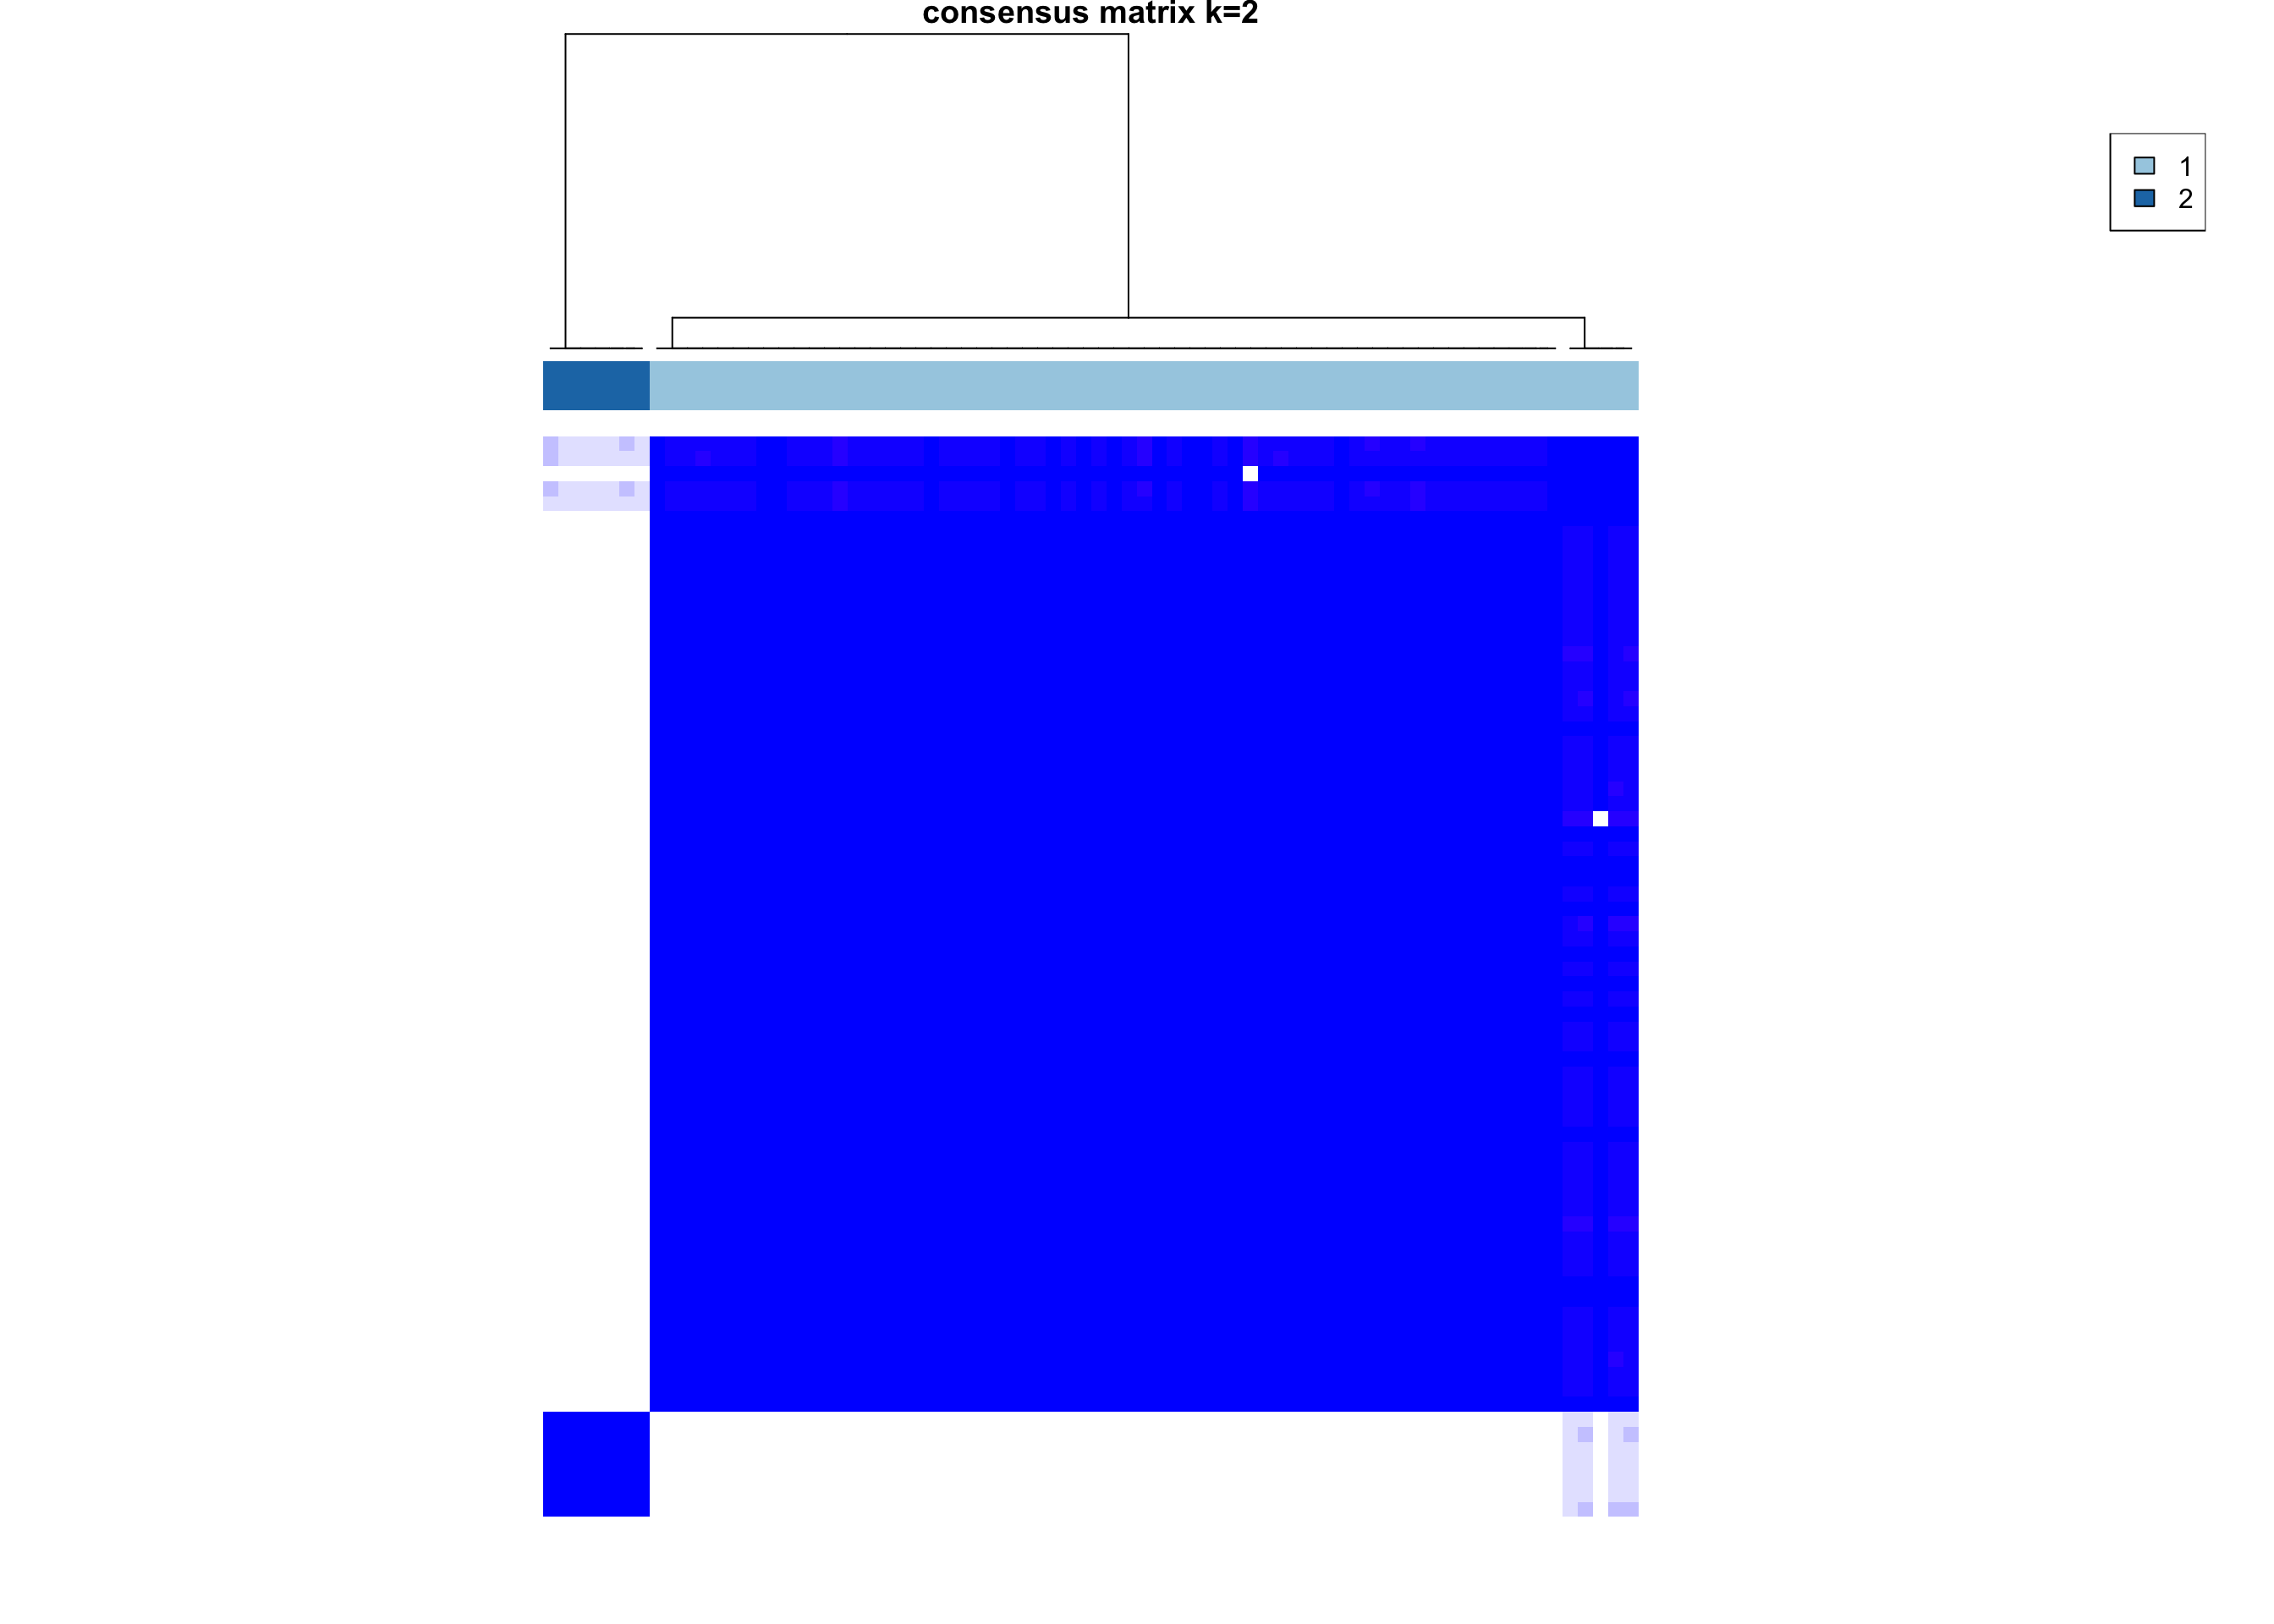
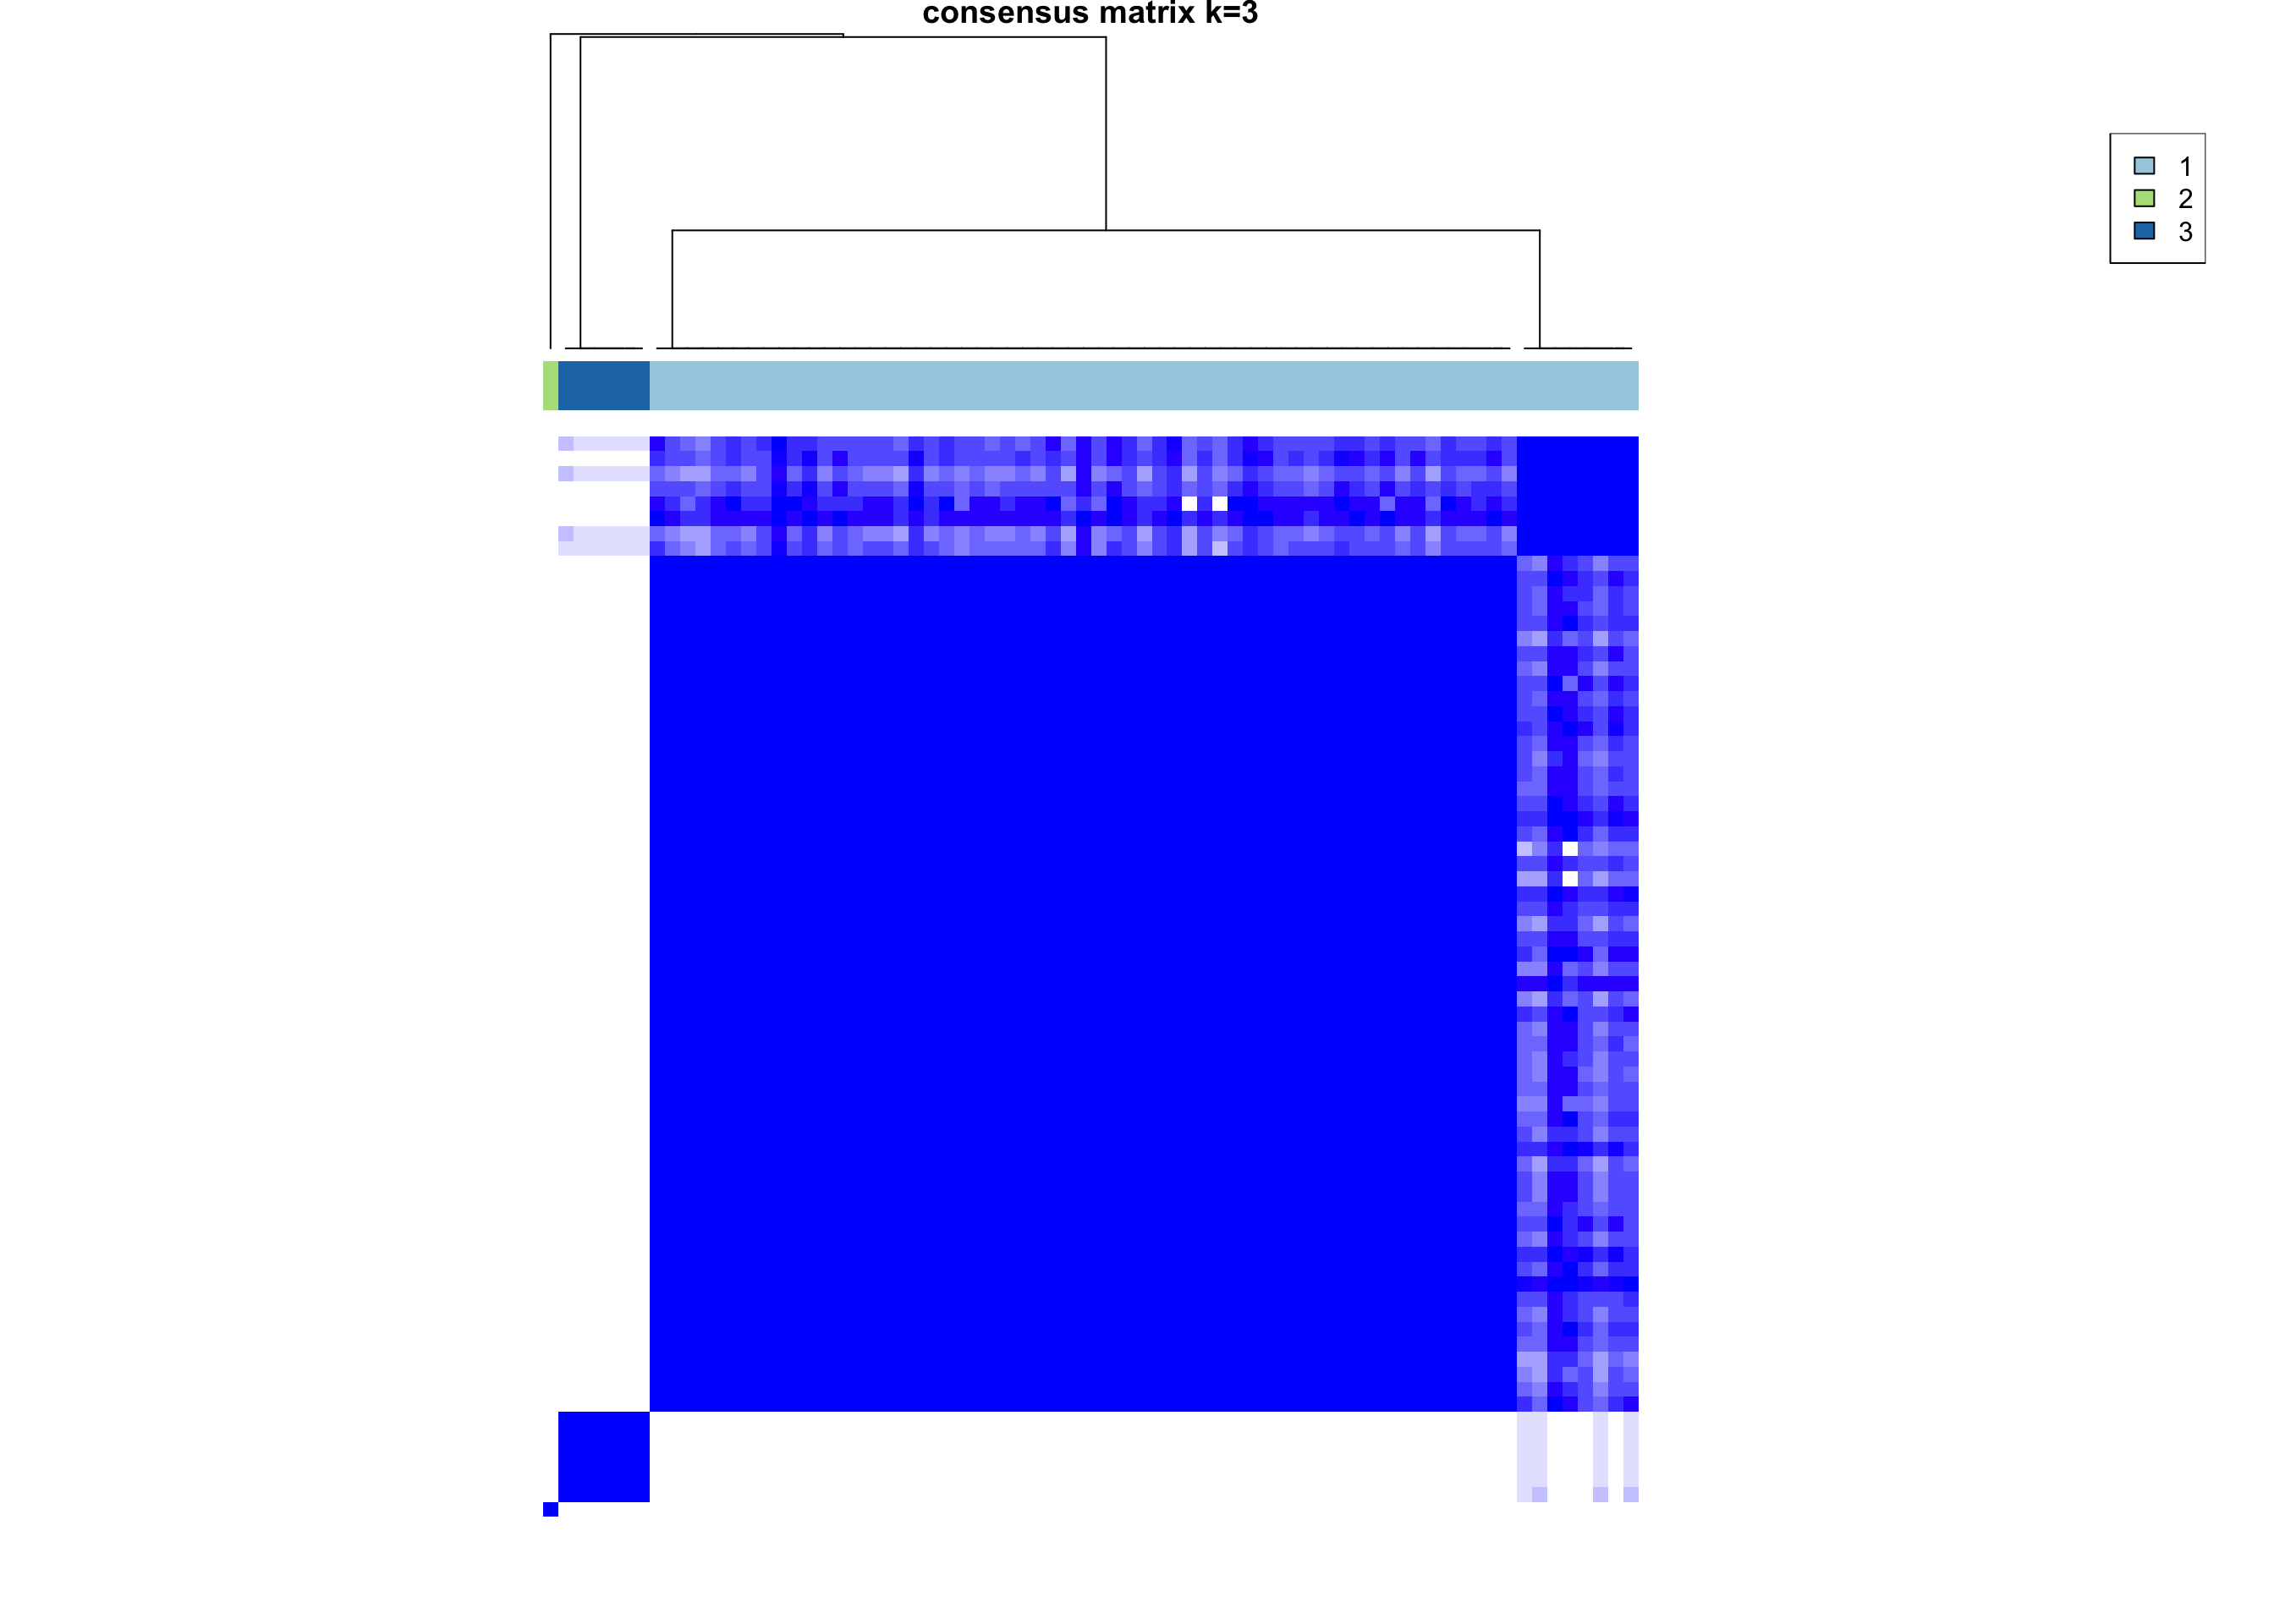
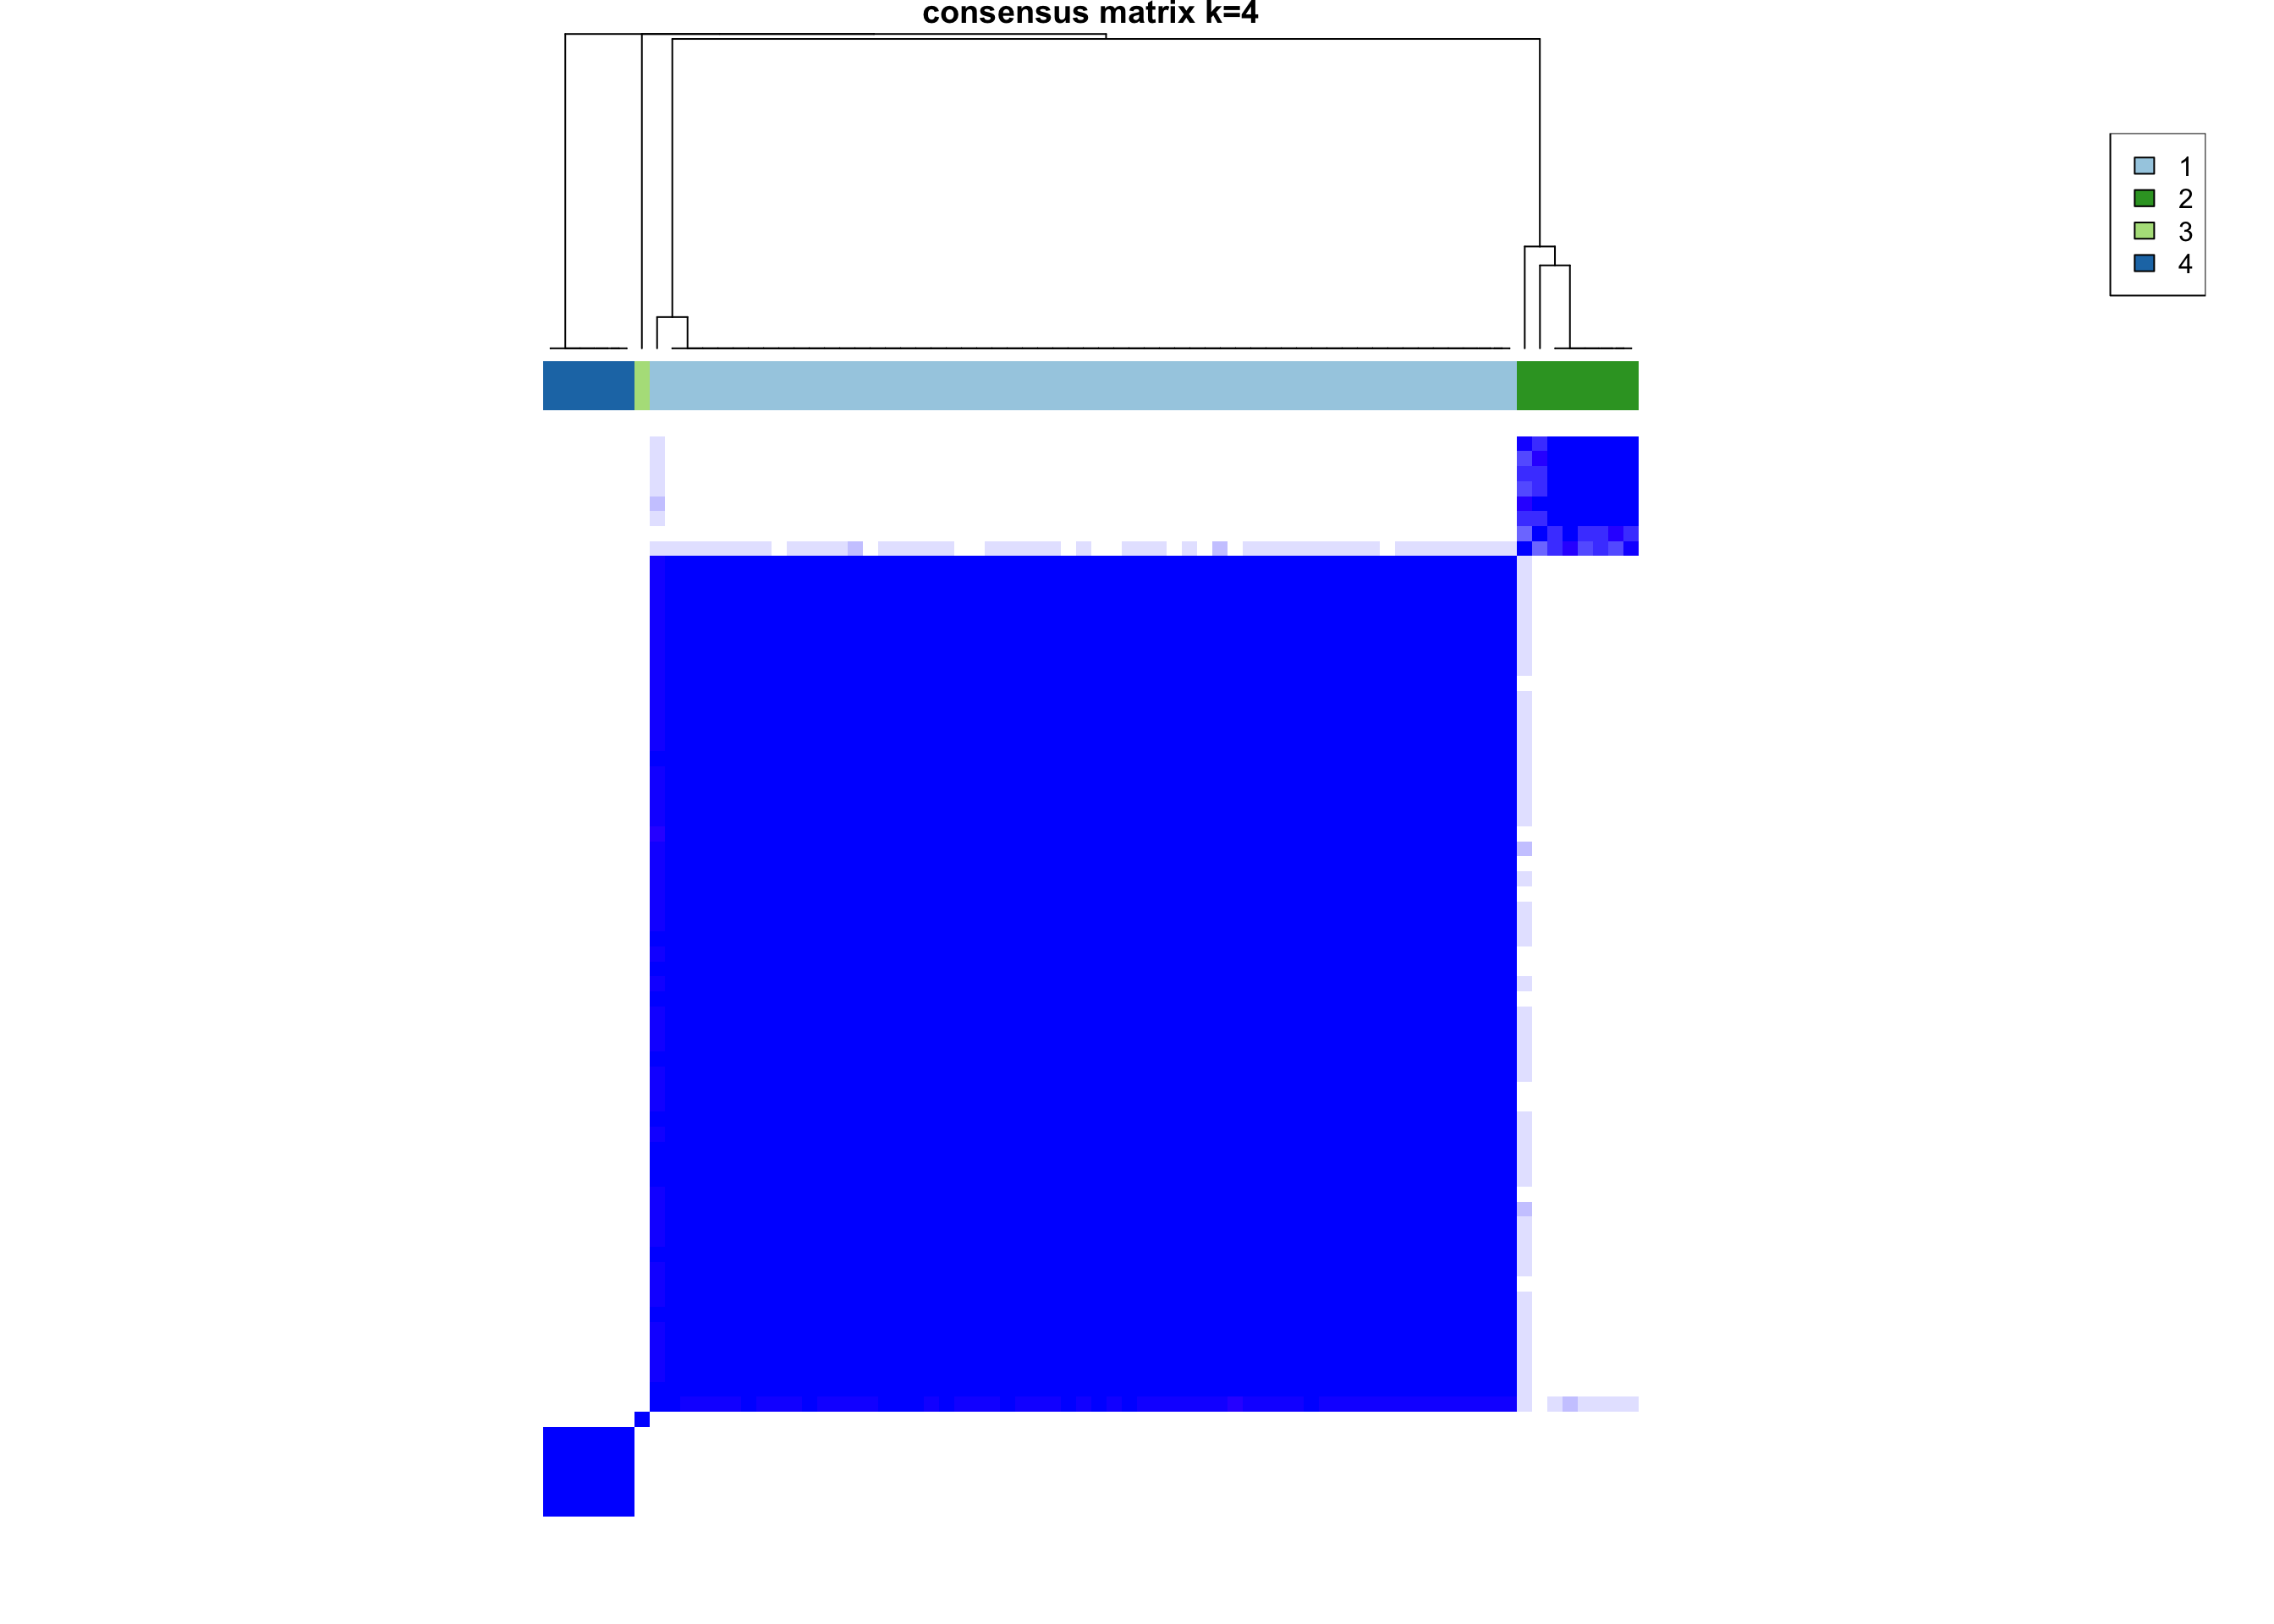
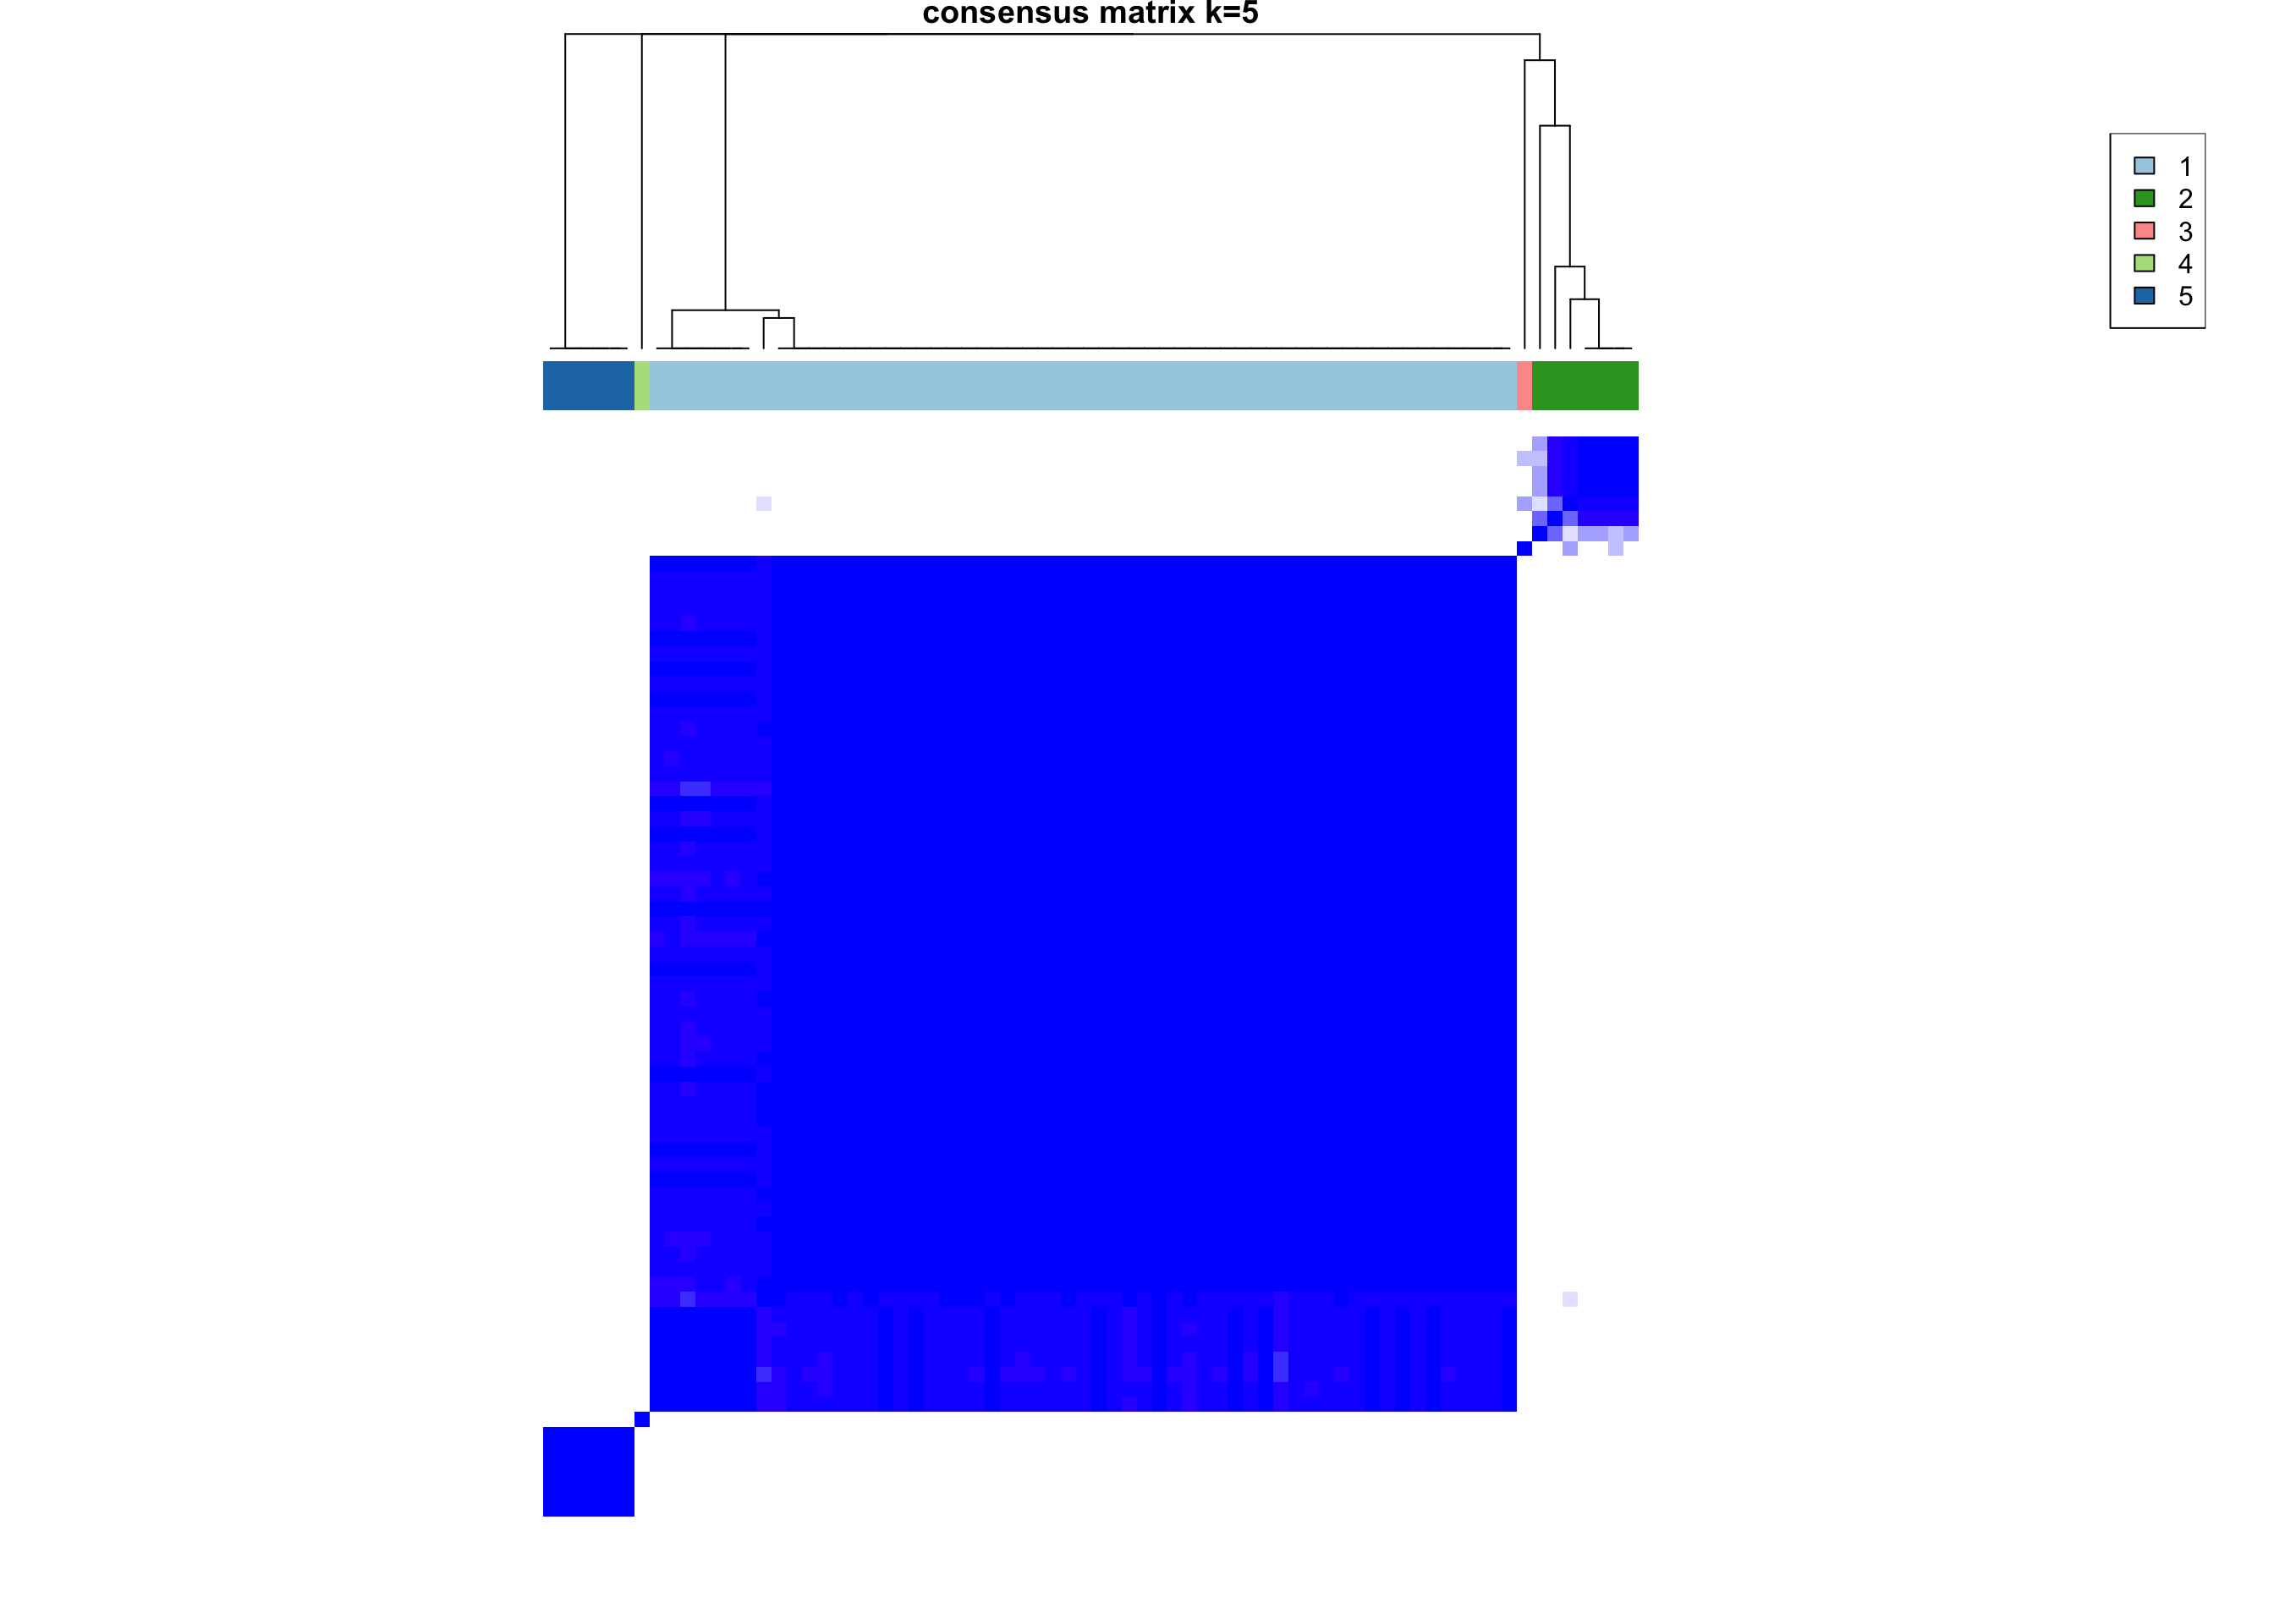
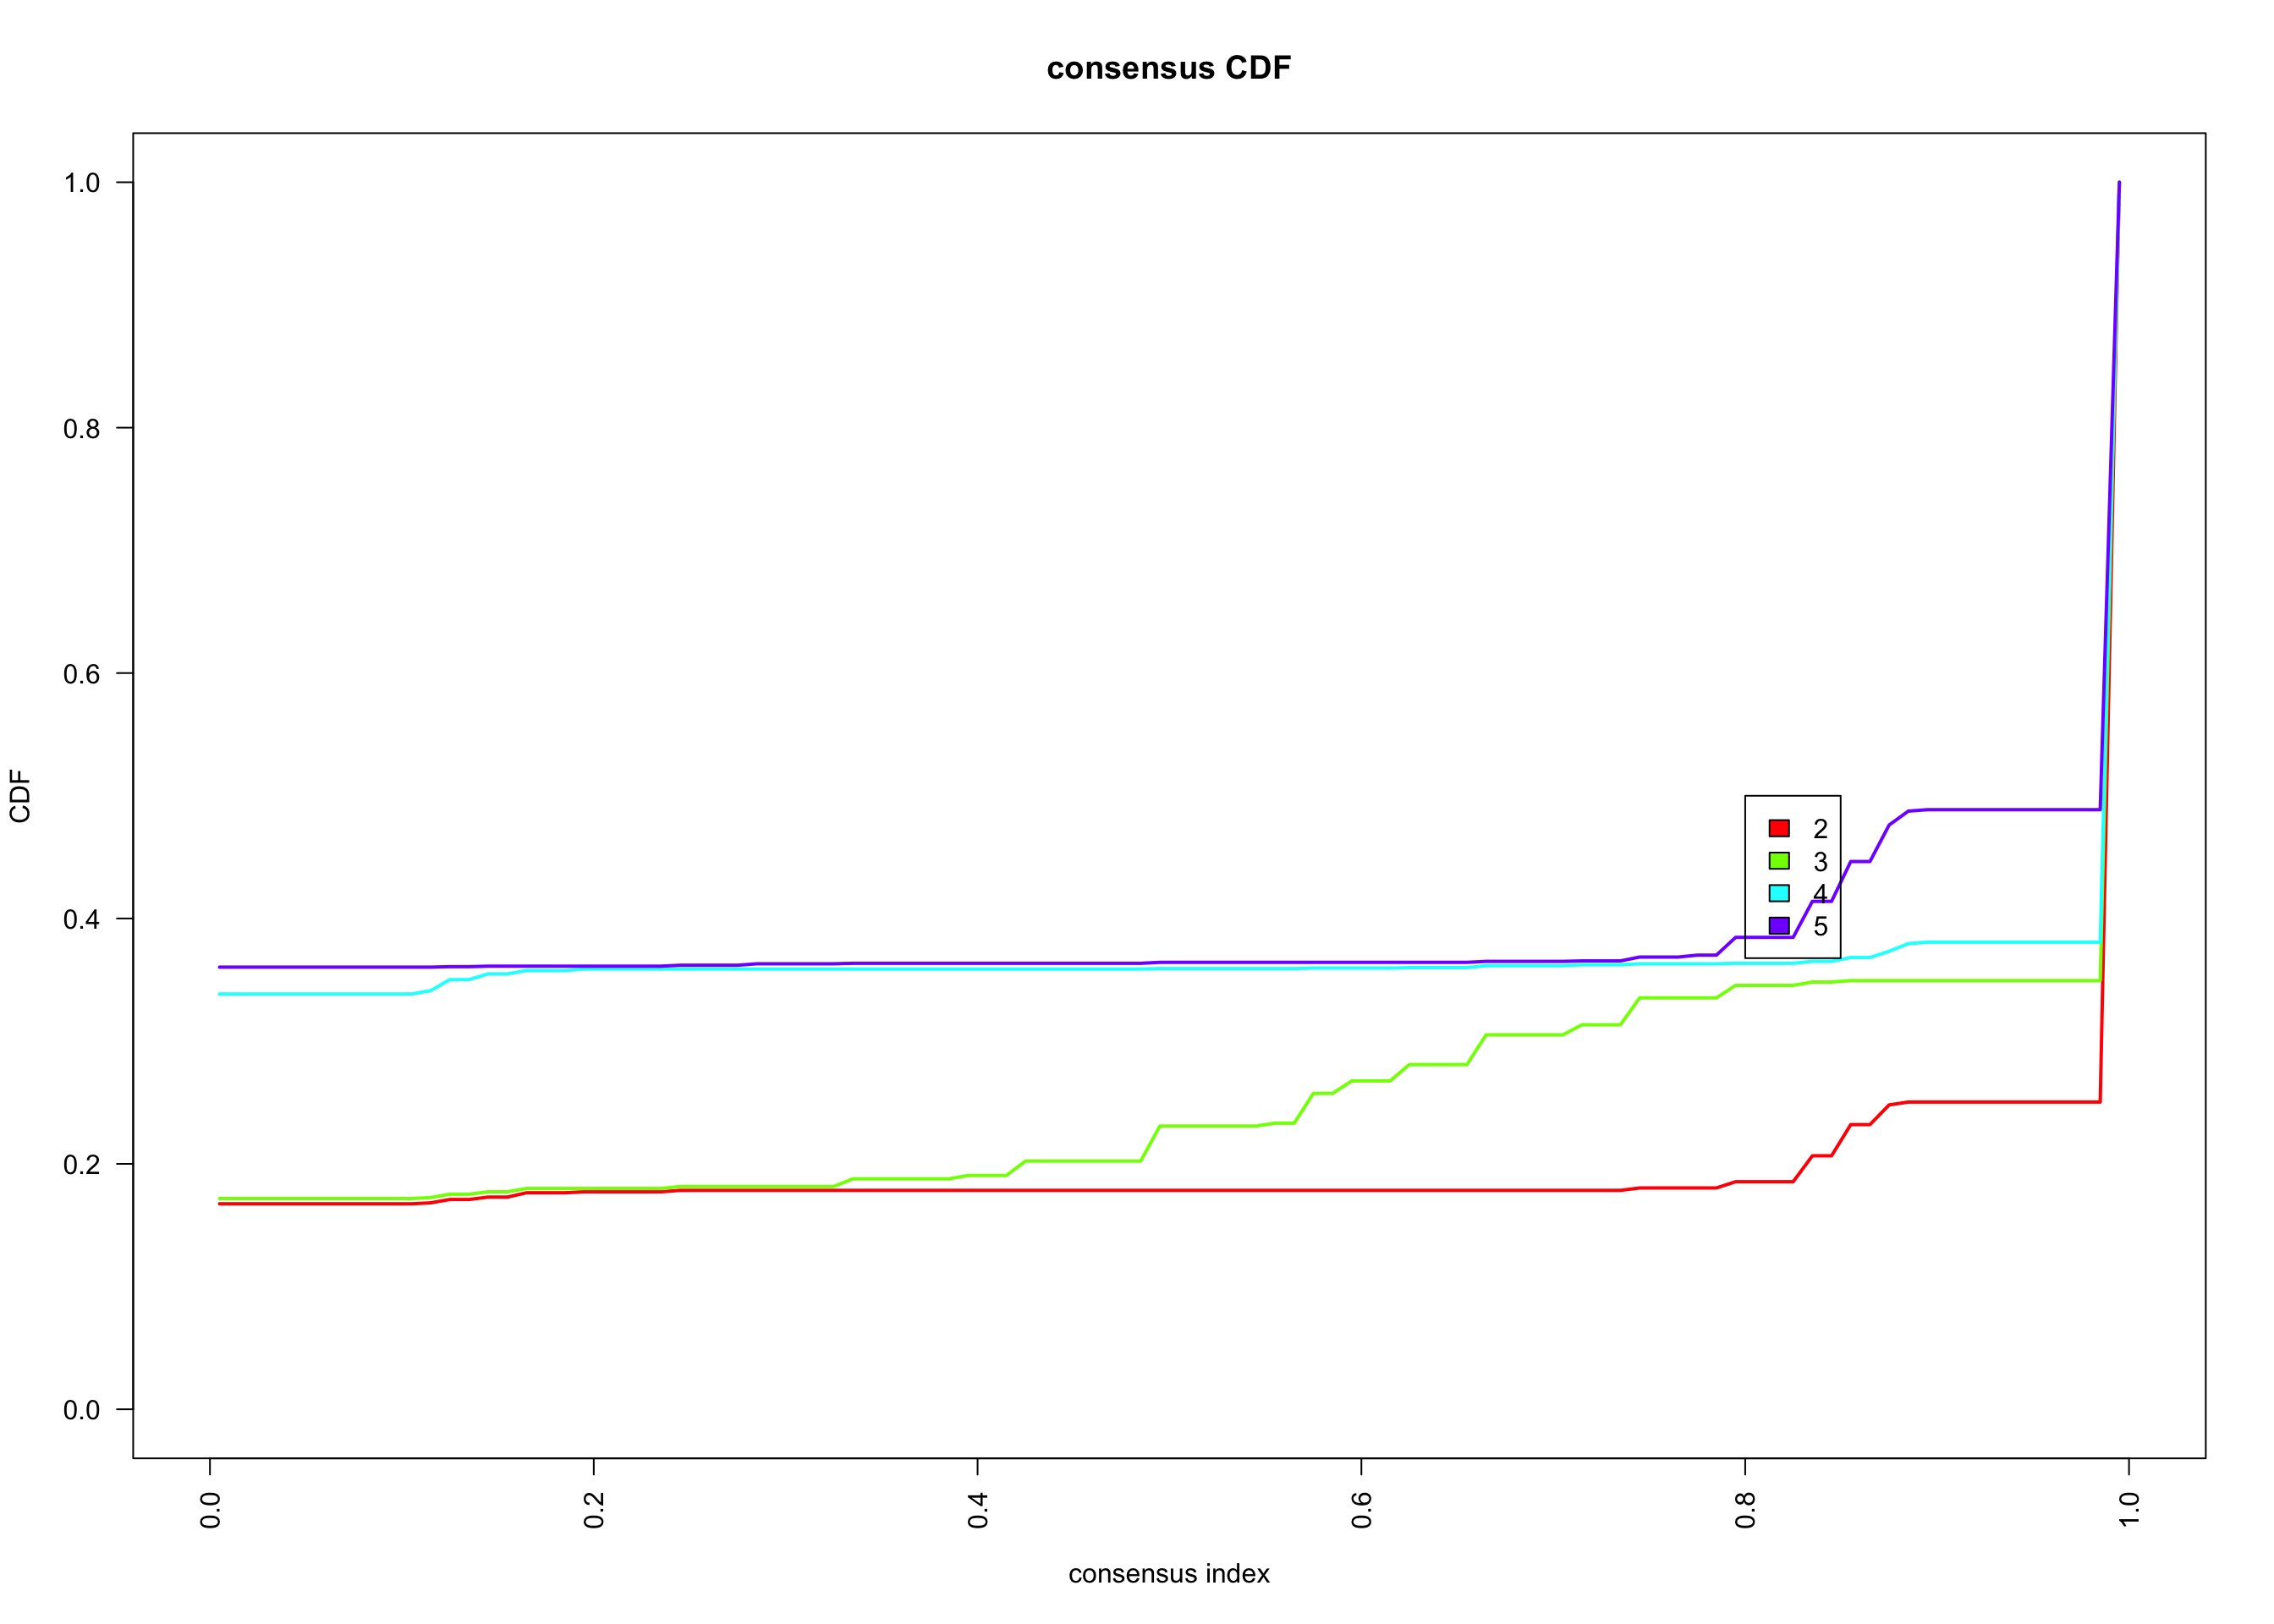
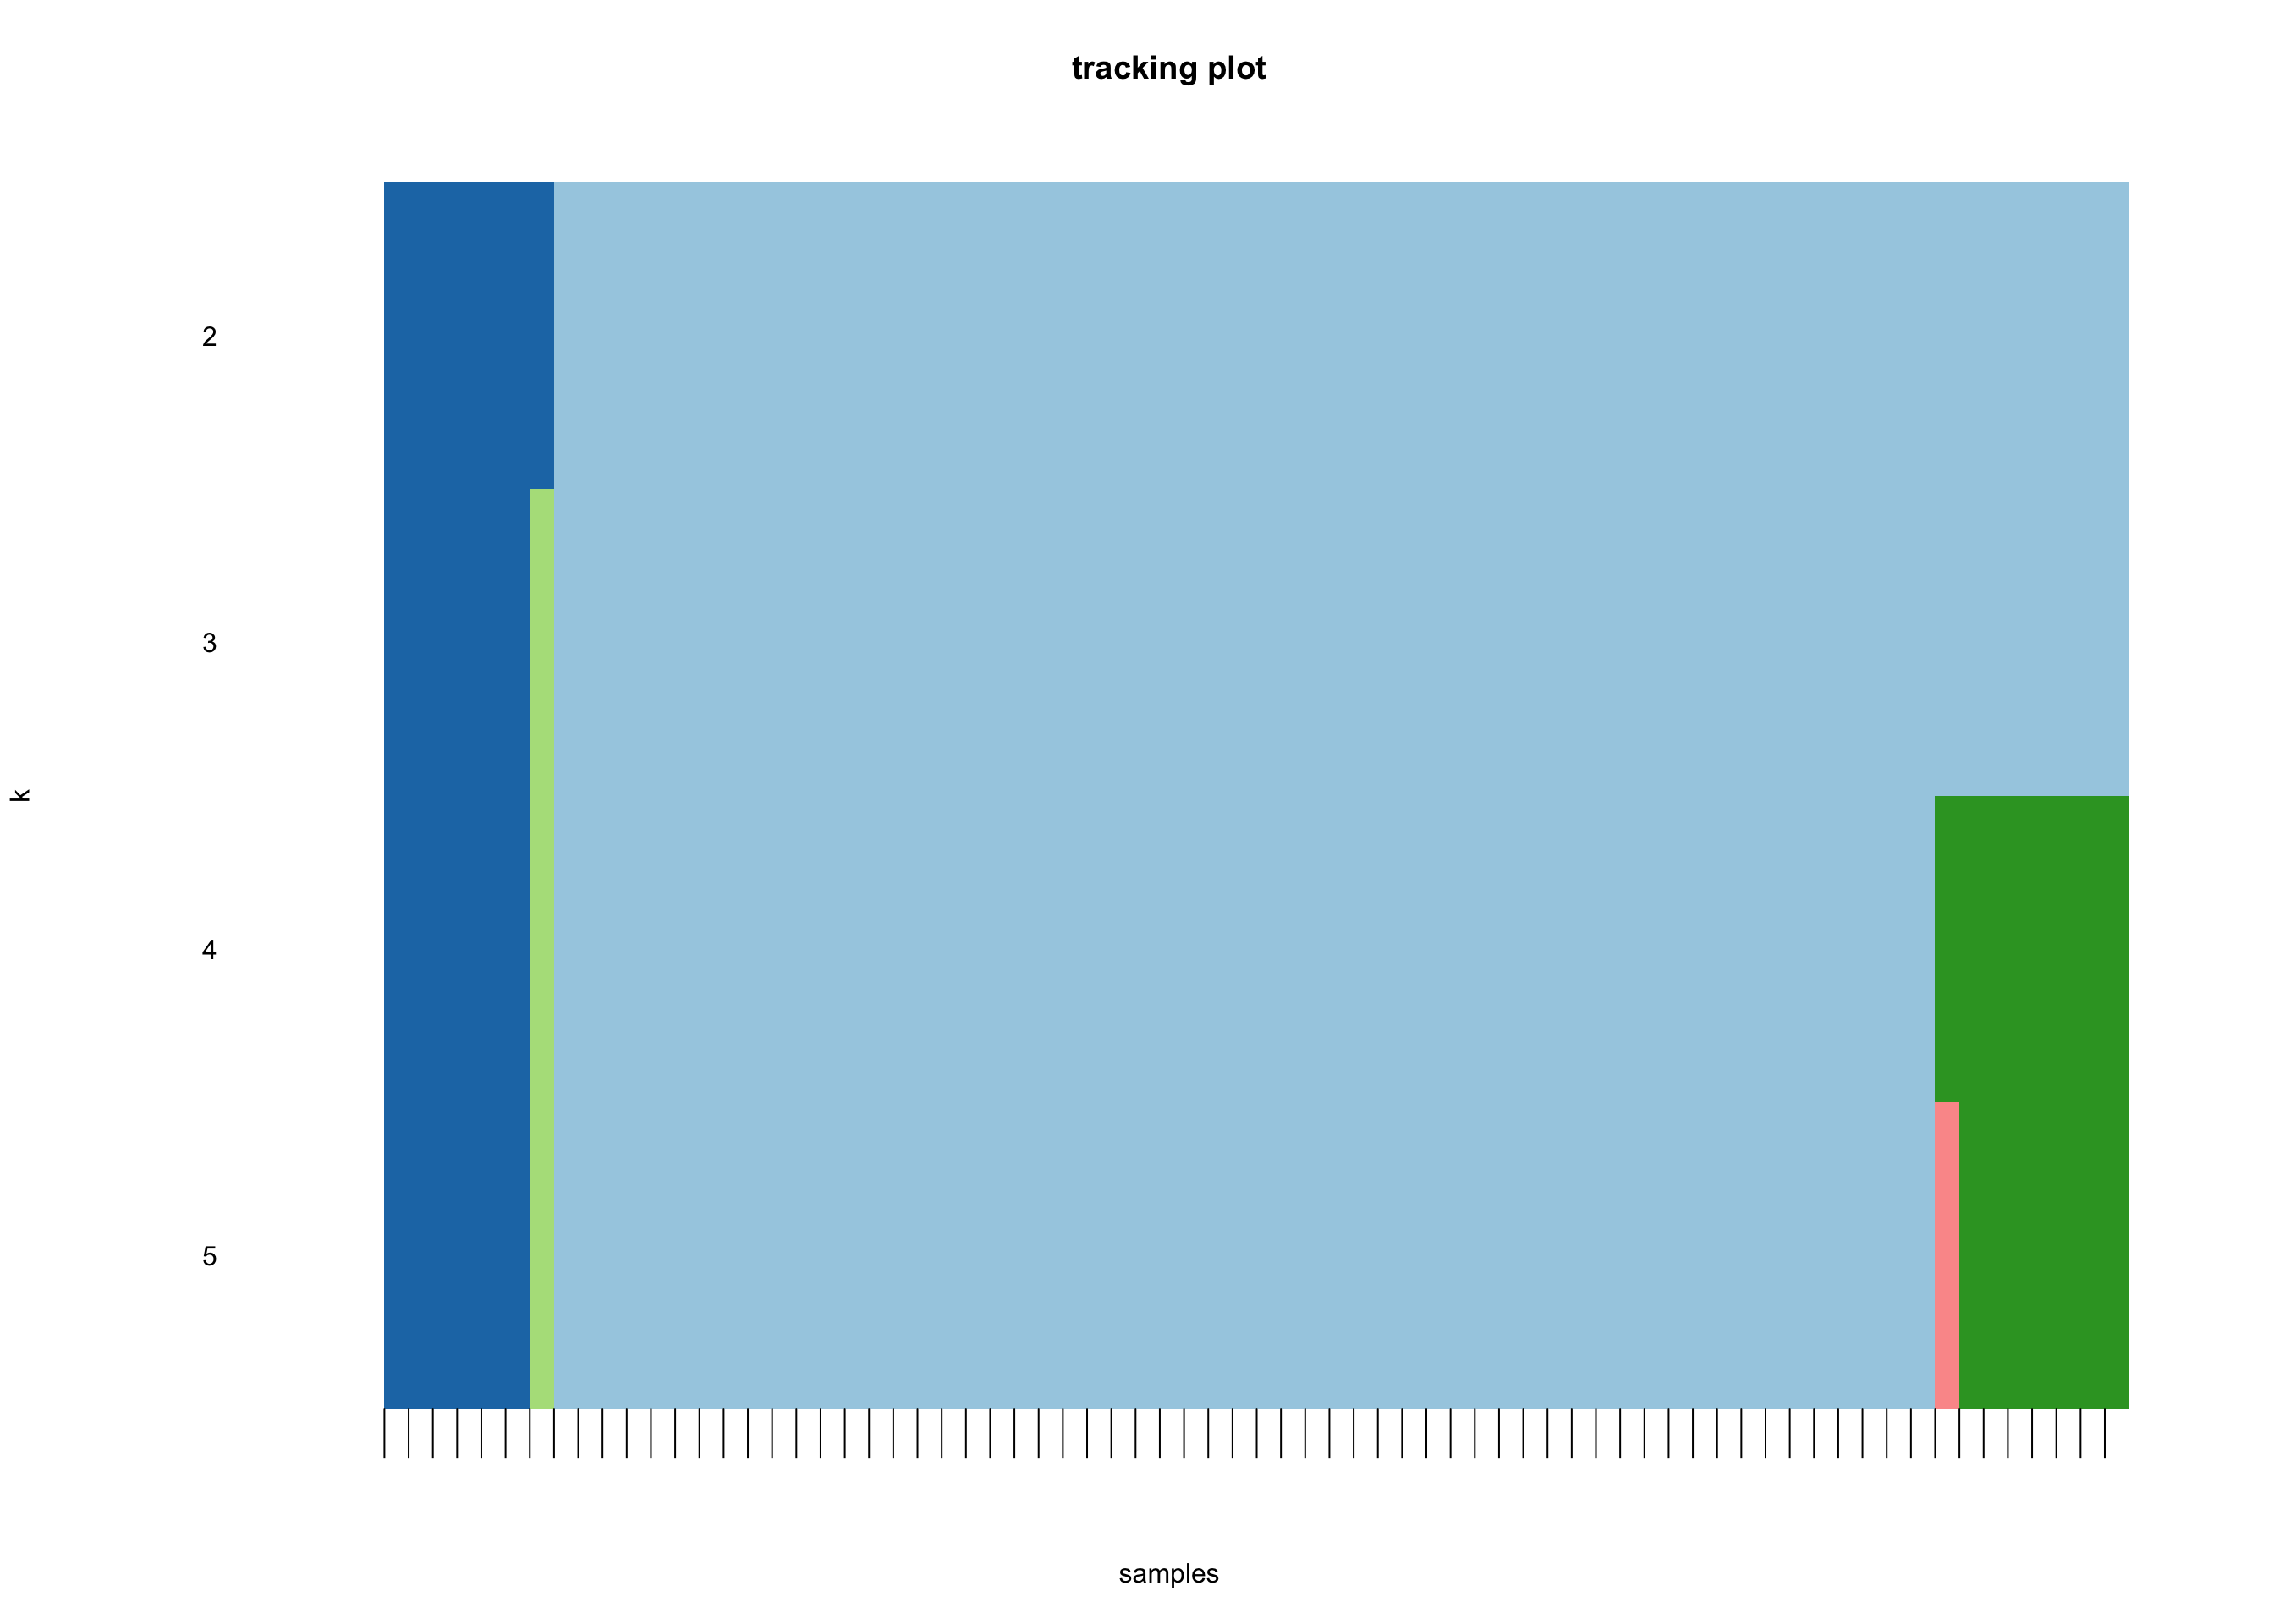
Consensus Clustering
heatmap_salmon_clean_ccp <-
  ConsensusClusterPlus::ConsensusClusterPlus(
    assay(salmon$clean$cvst), maxK = 5, pItem = 0.8,
    pFeature = 0.8, seed = global_seed)