Reference: |
Montgomery S.B., Griffith O.L., Schuetz J.M., Brooks-Wilson, A., Jones S.J.M. "A Computational Discrimination Strategy For Regulatory Polymorphisms In The Upstream Non-Coding Regions of Homo Sapiens" (Submitted). |
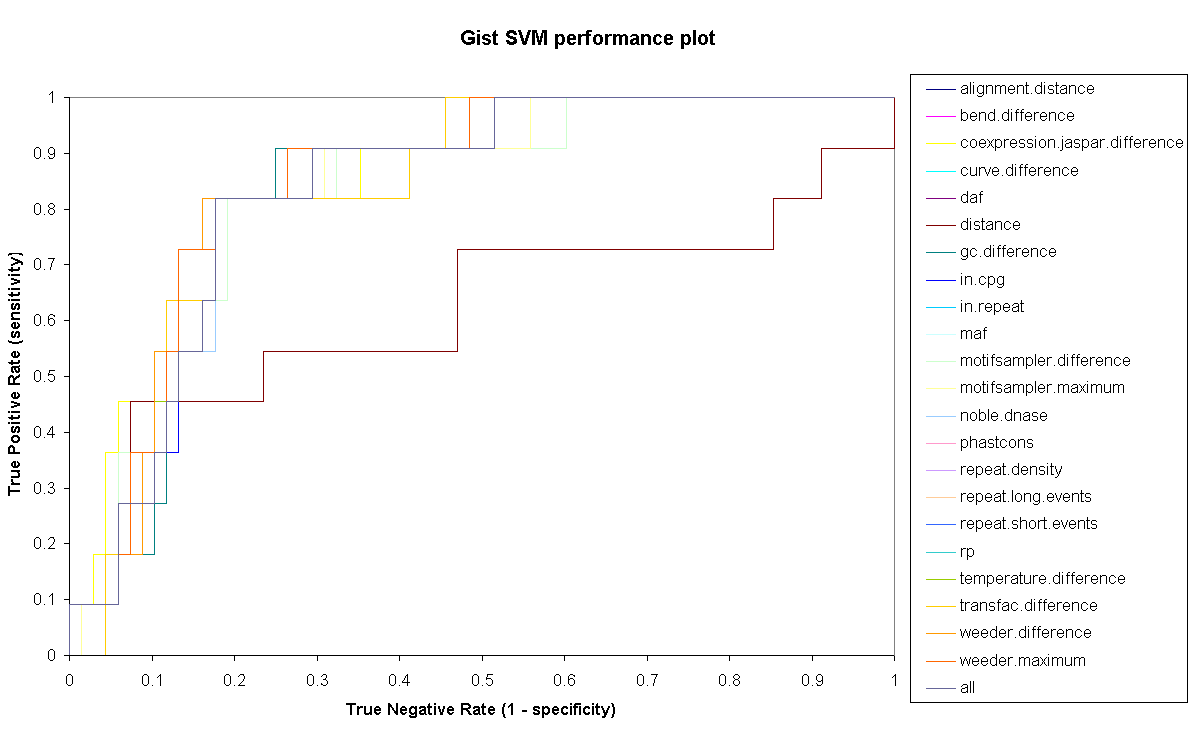
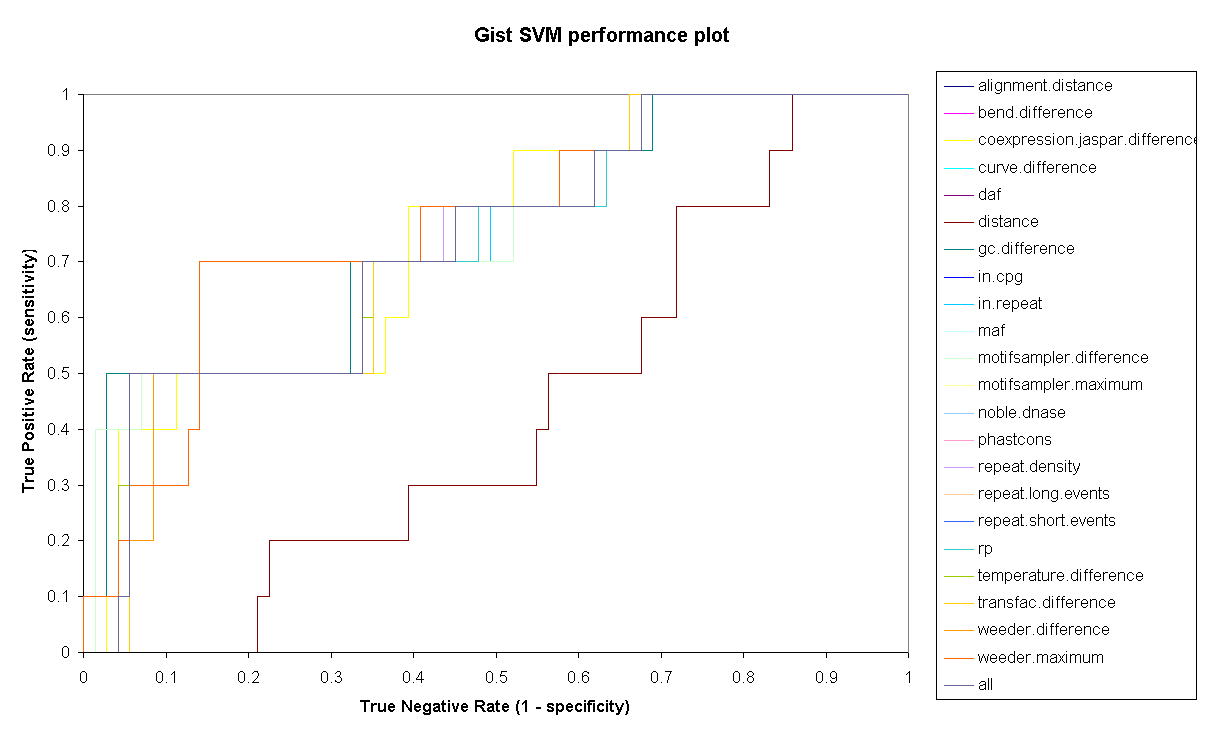
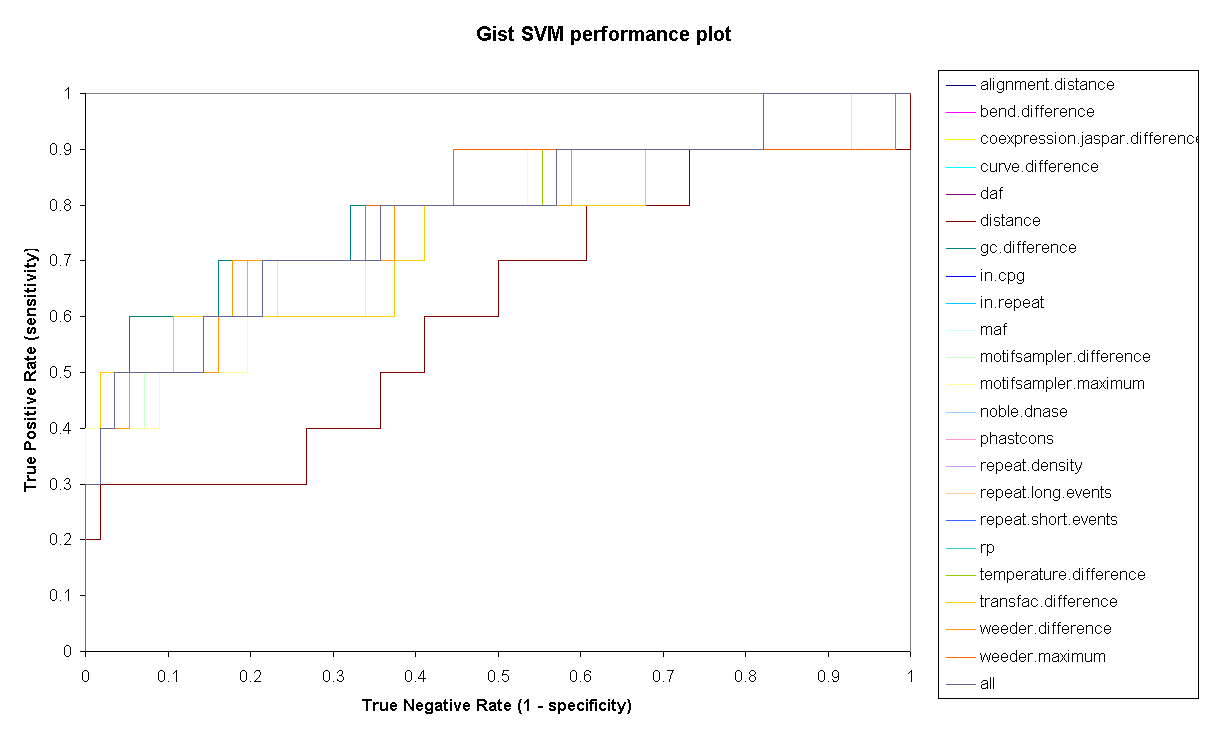
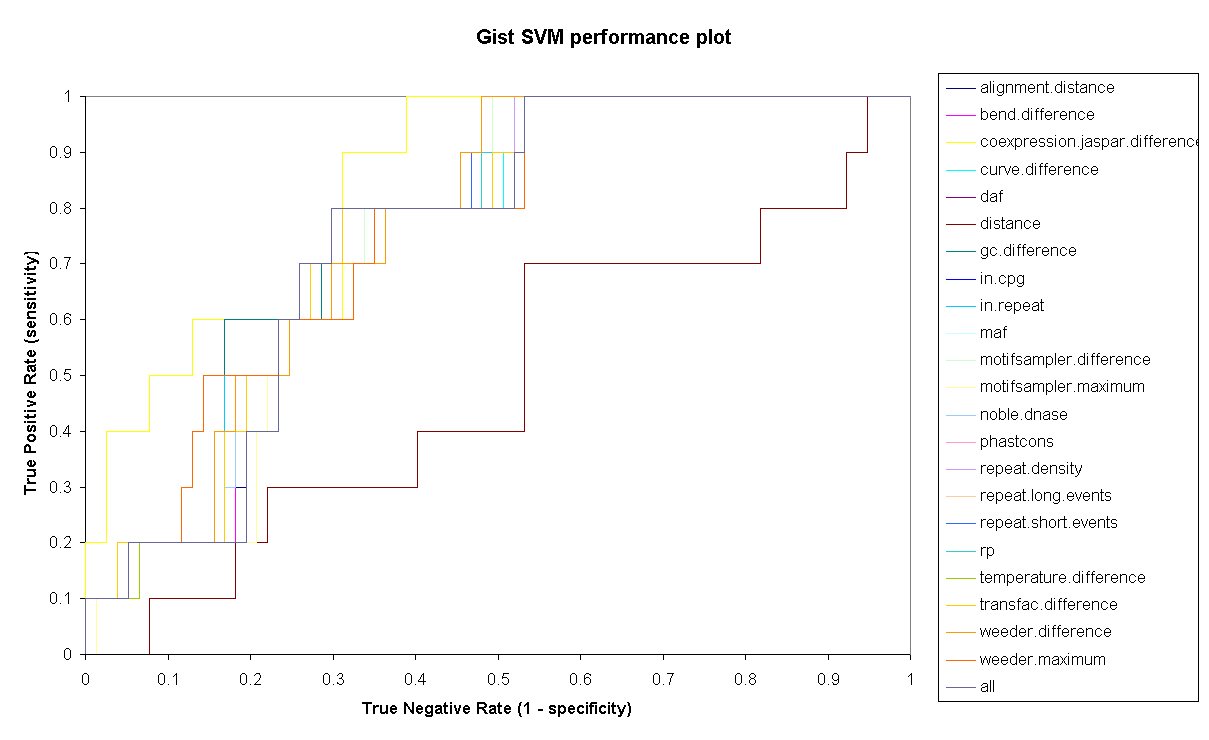
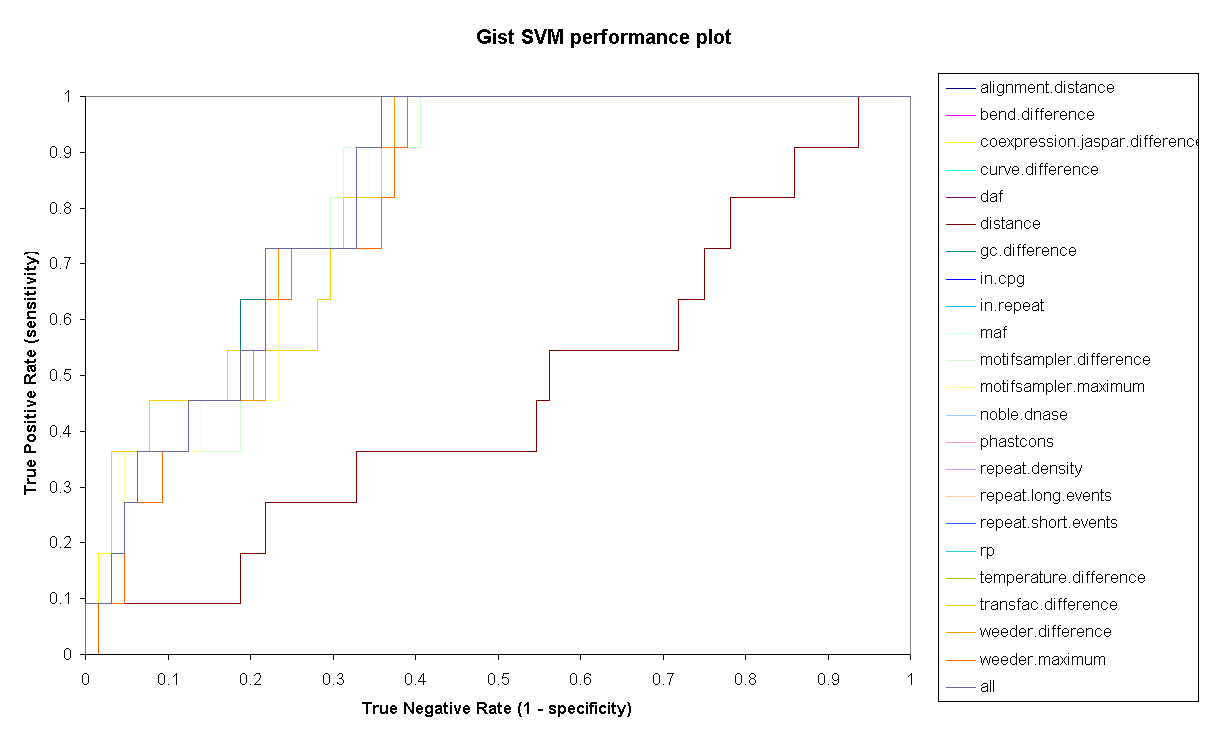
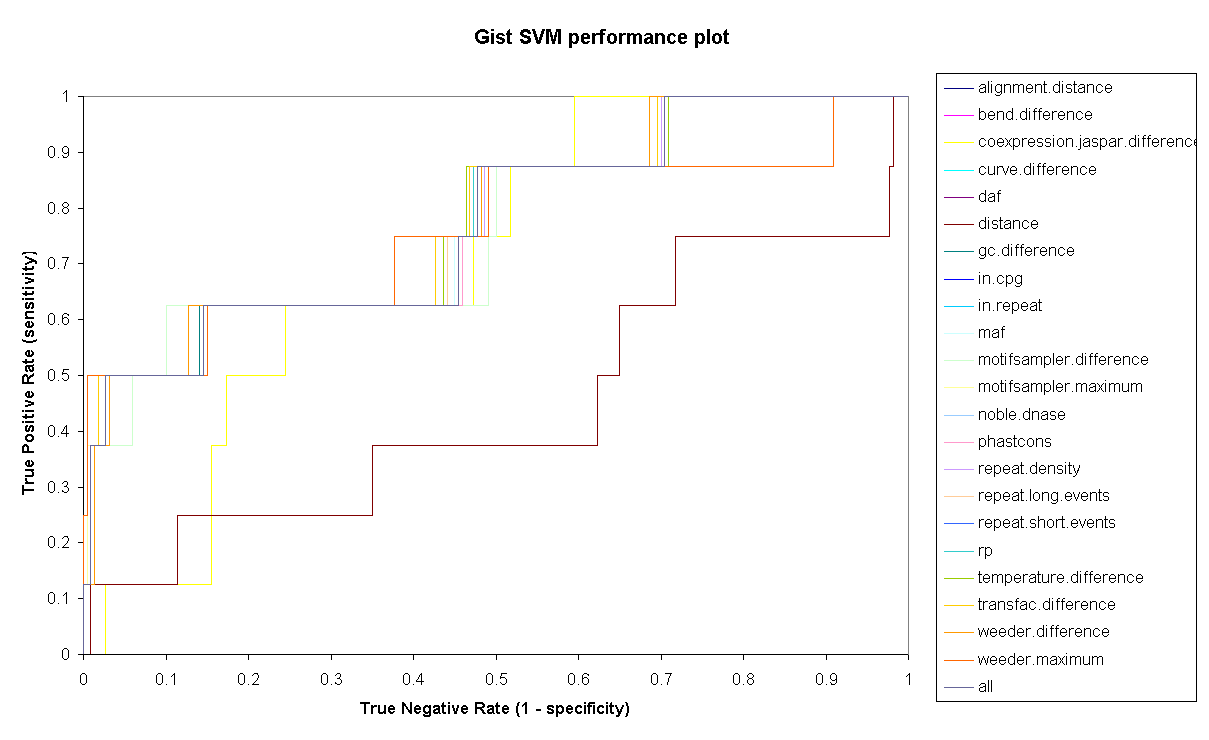
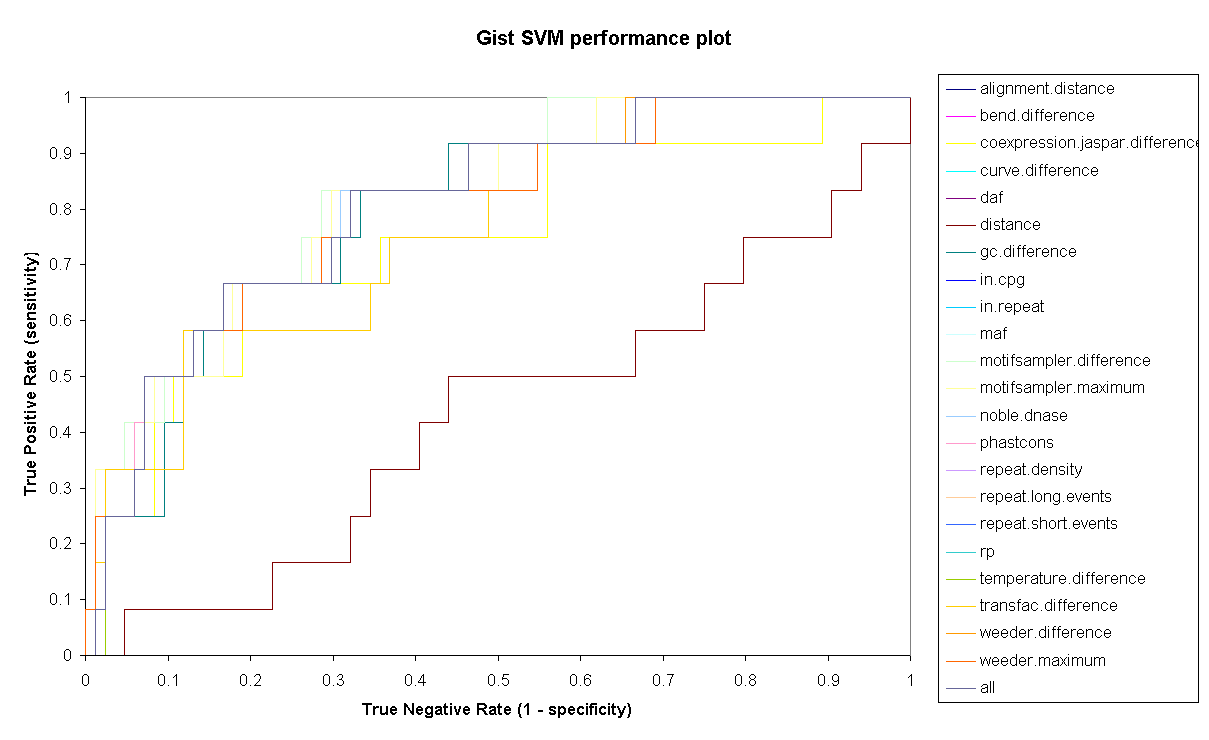
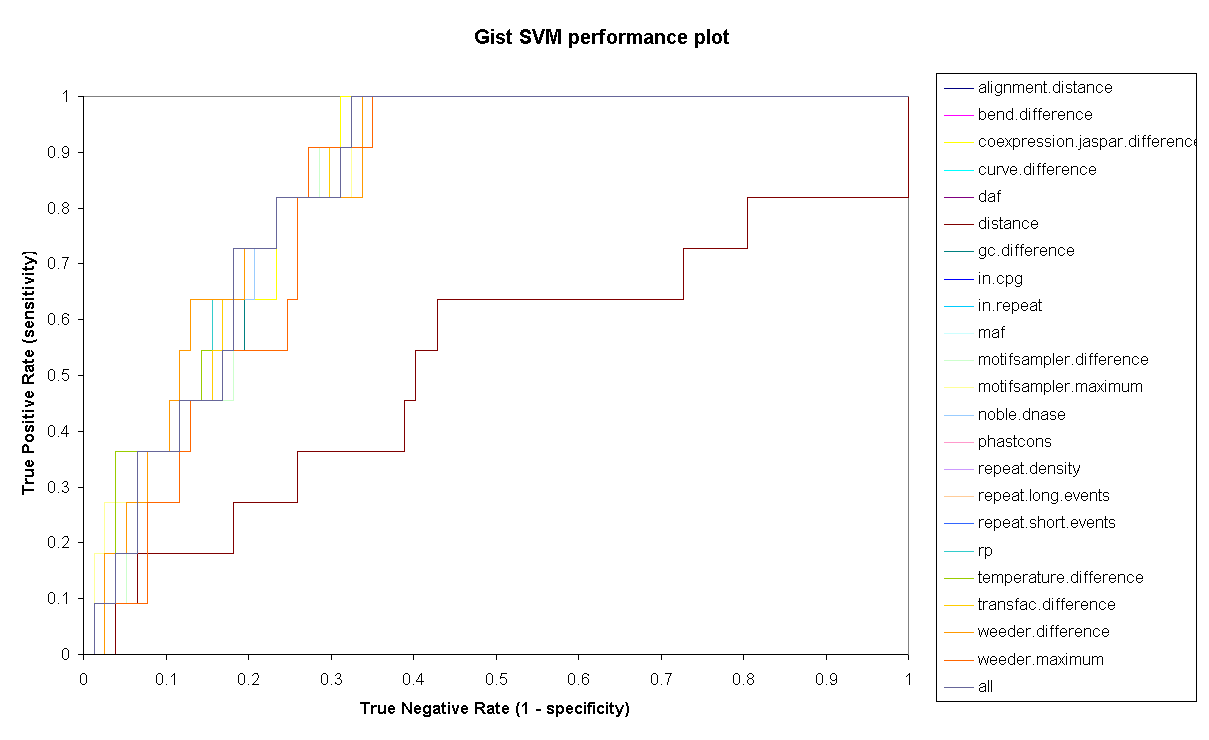
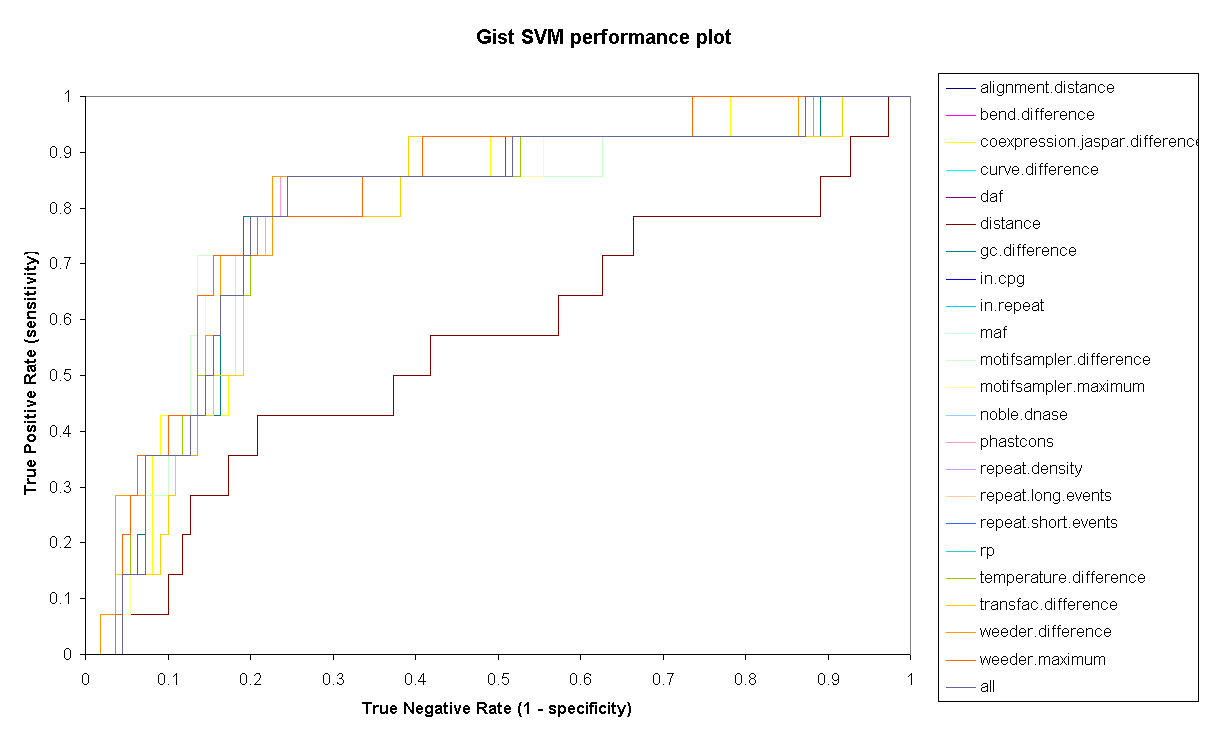
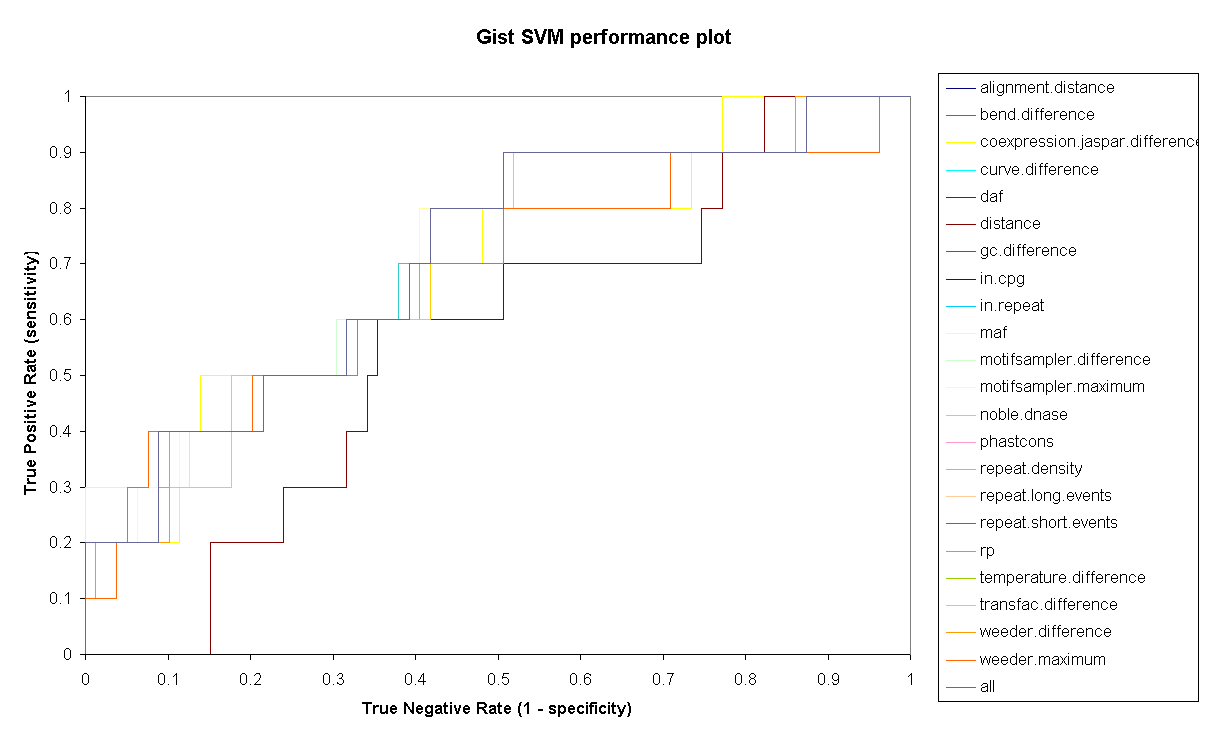
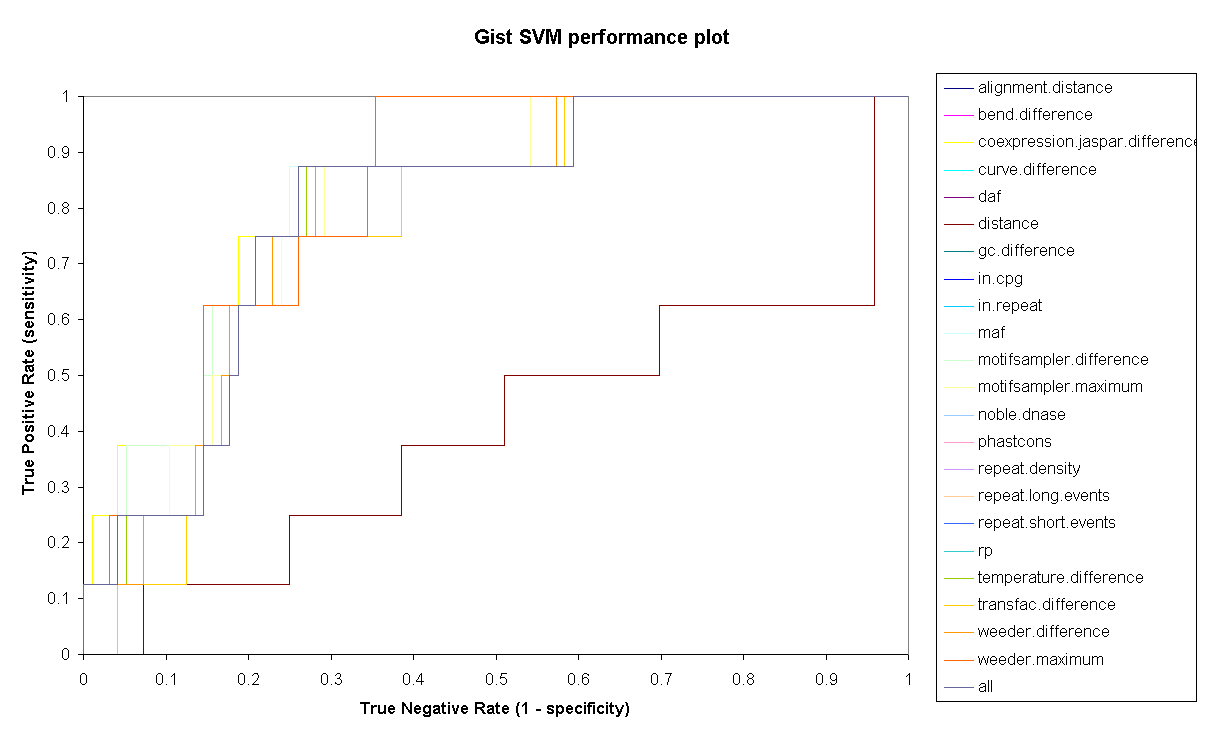
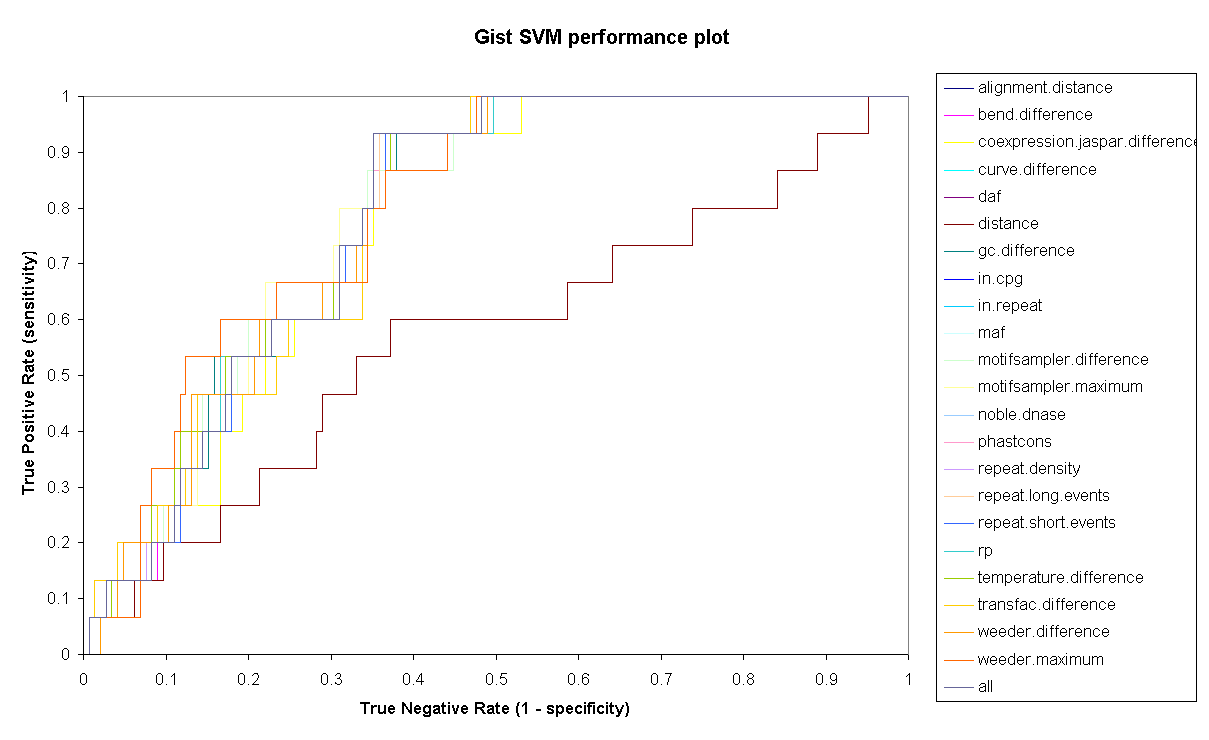
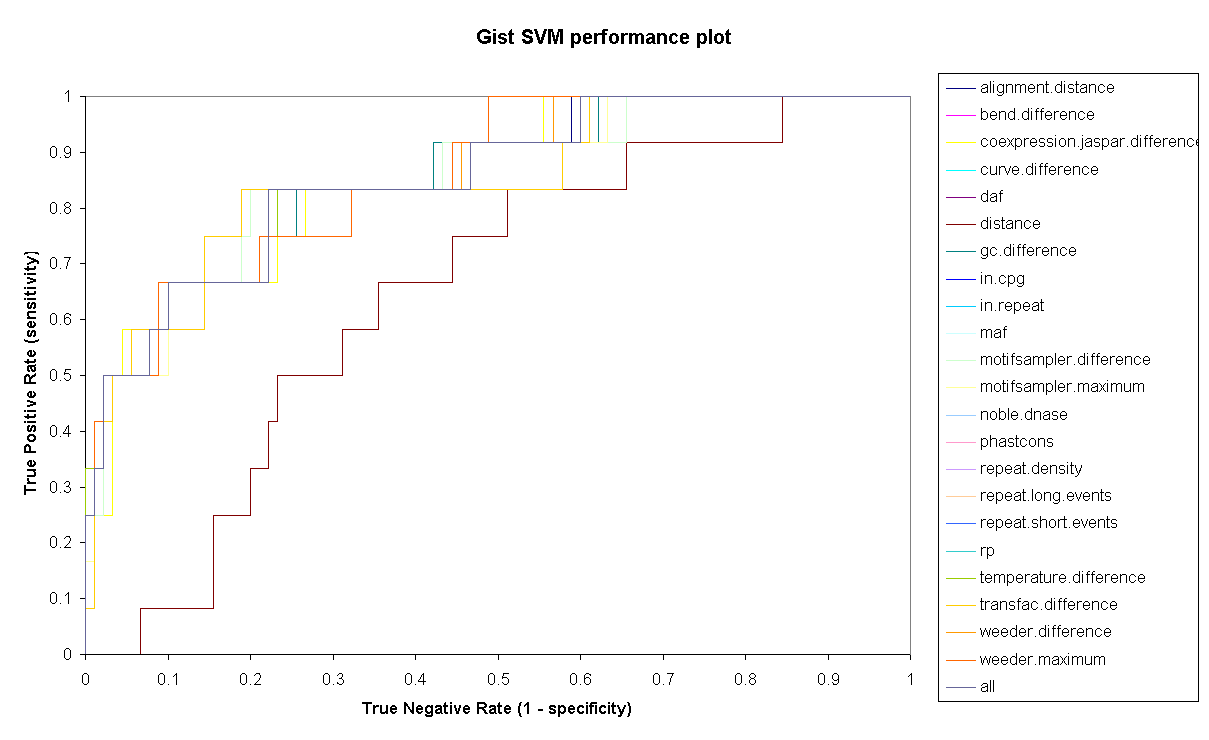
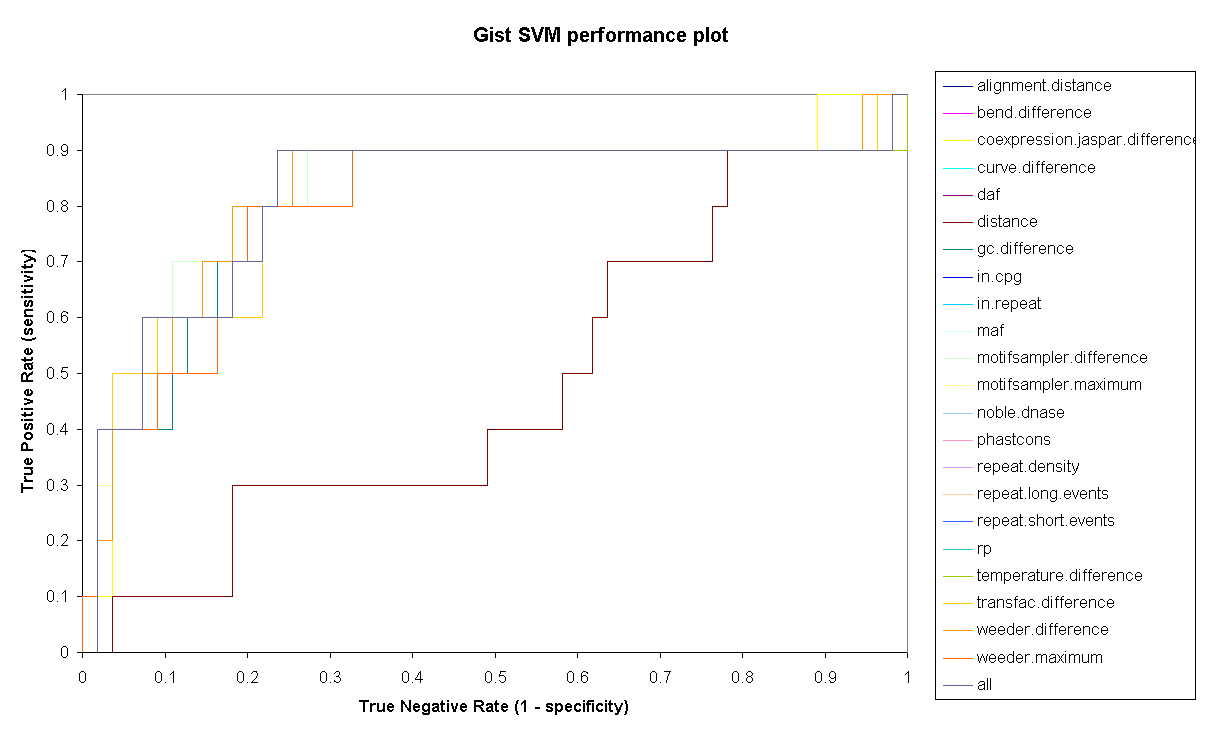
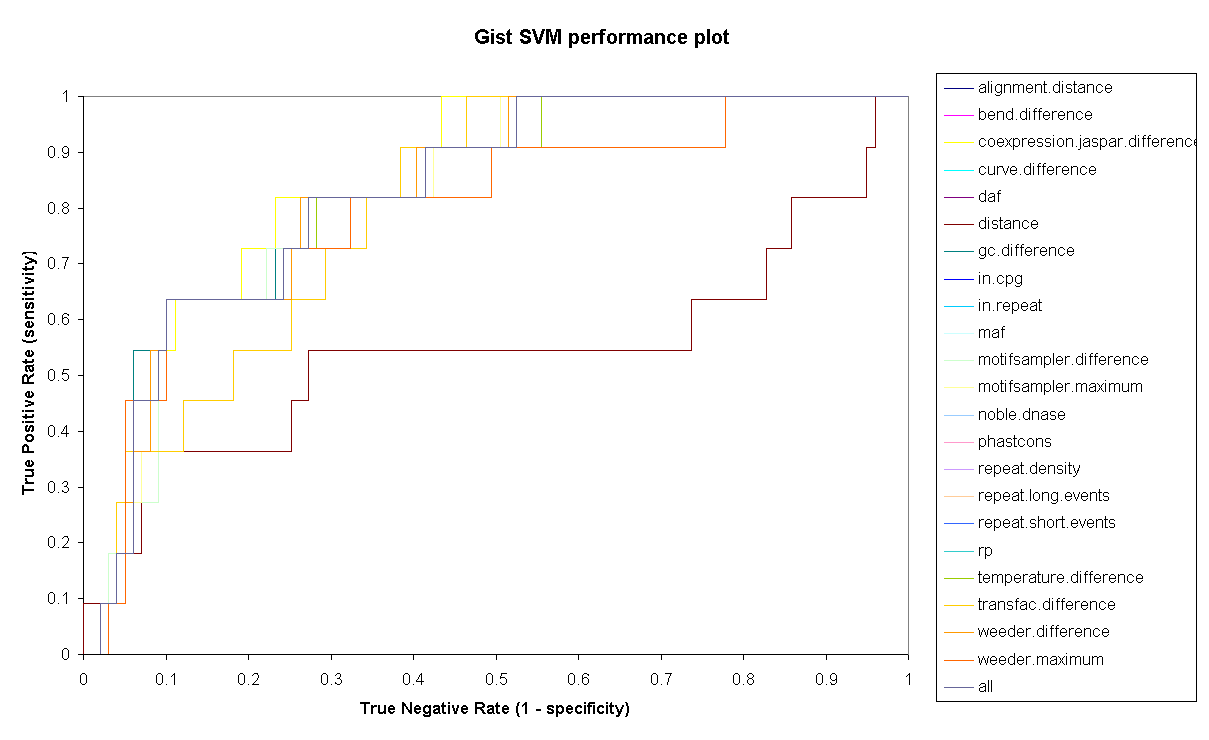
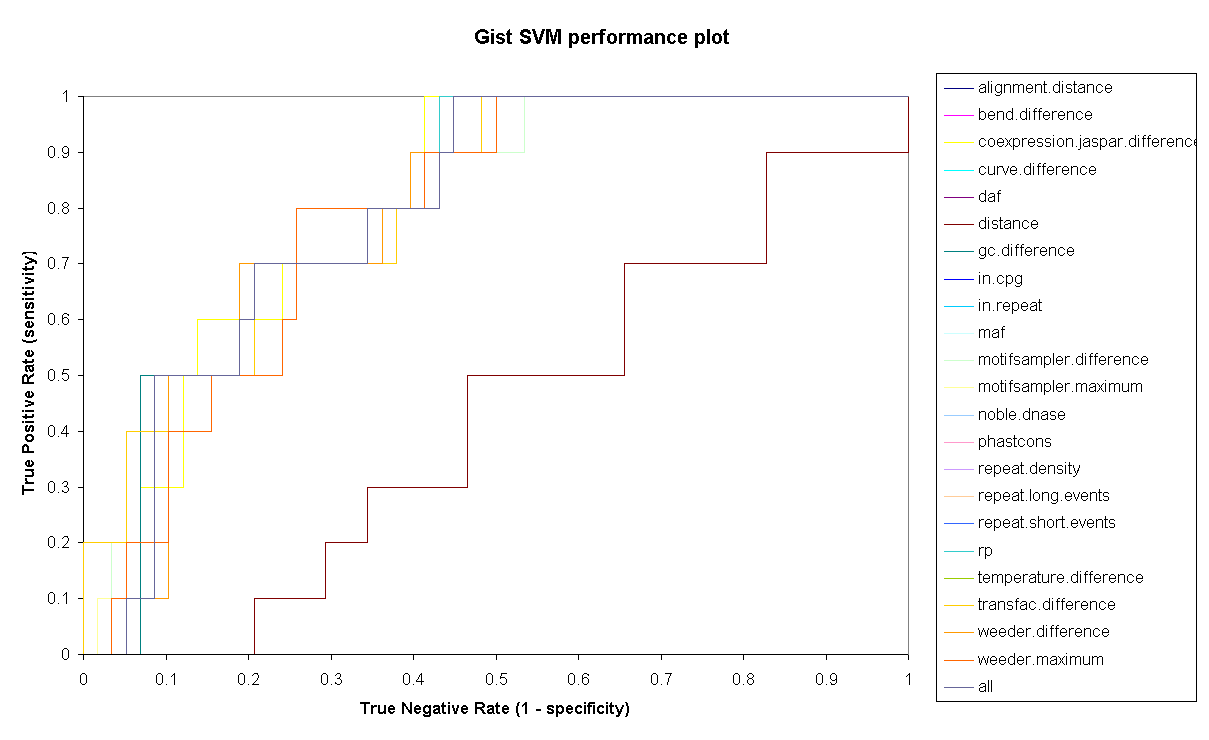
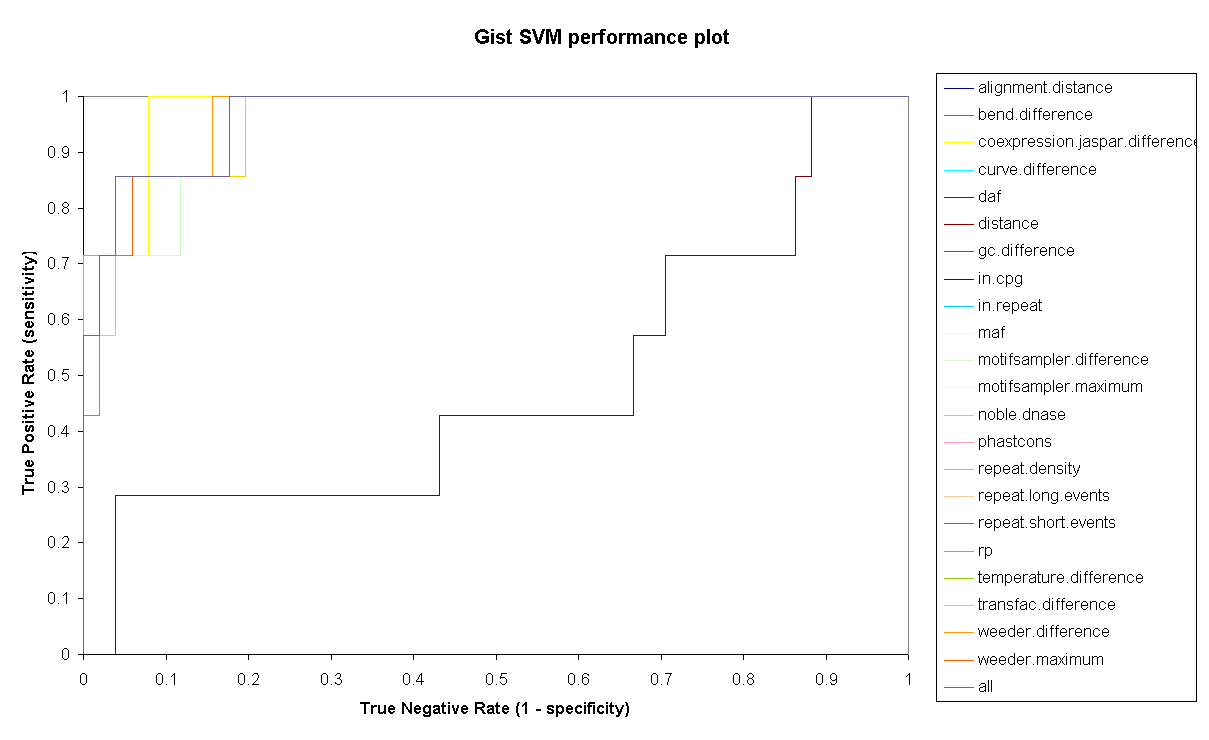
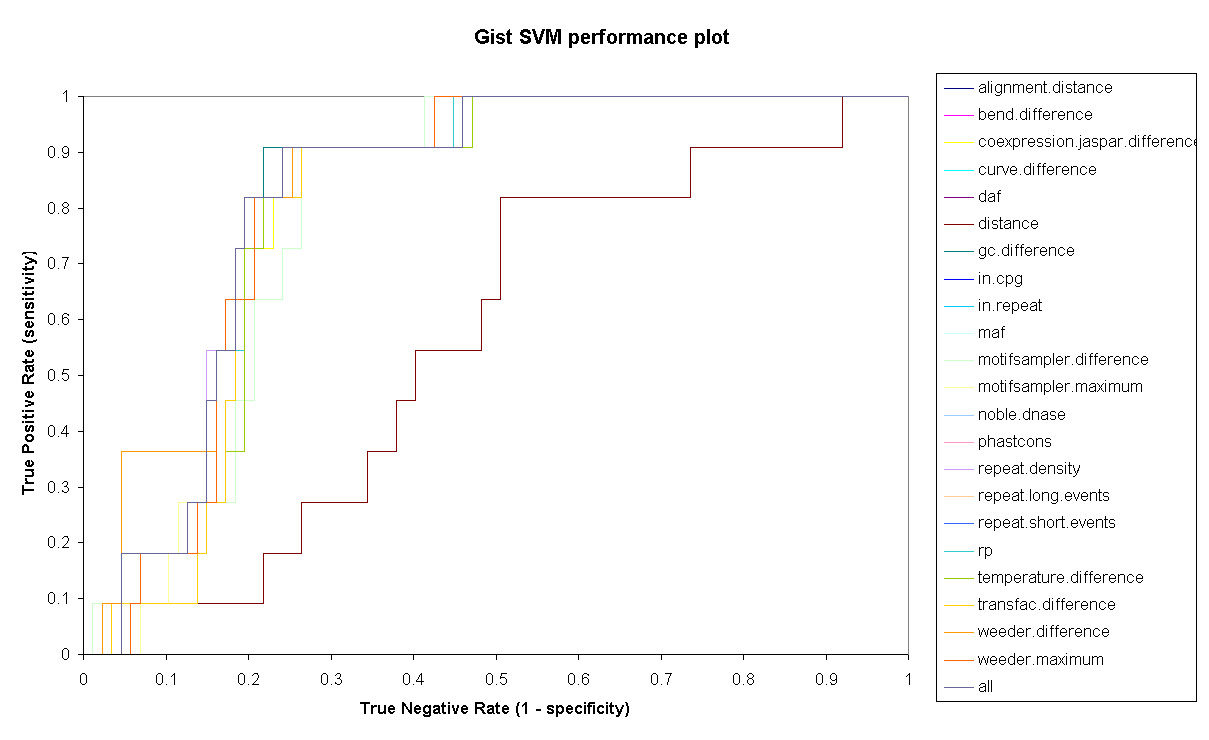
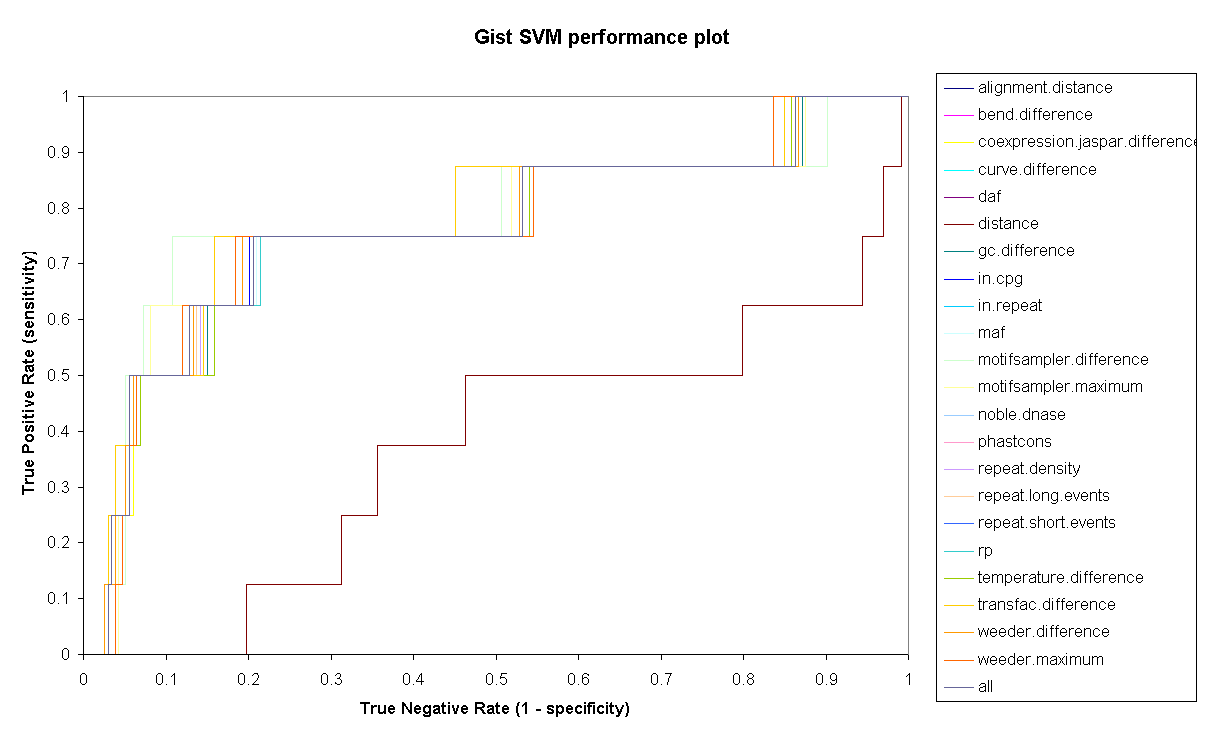
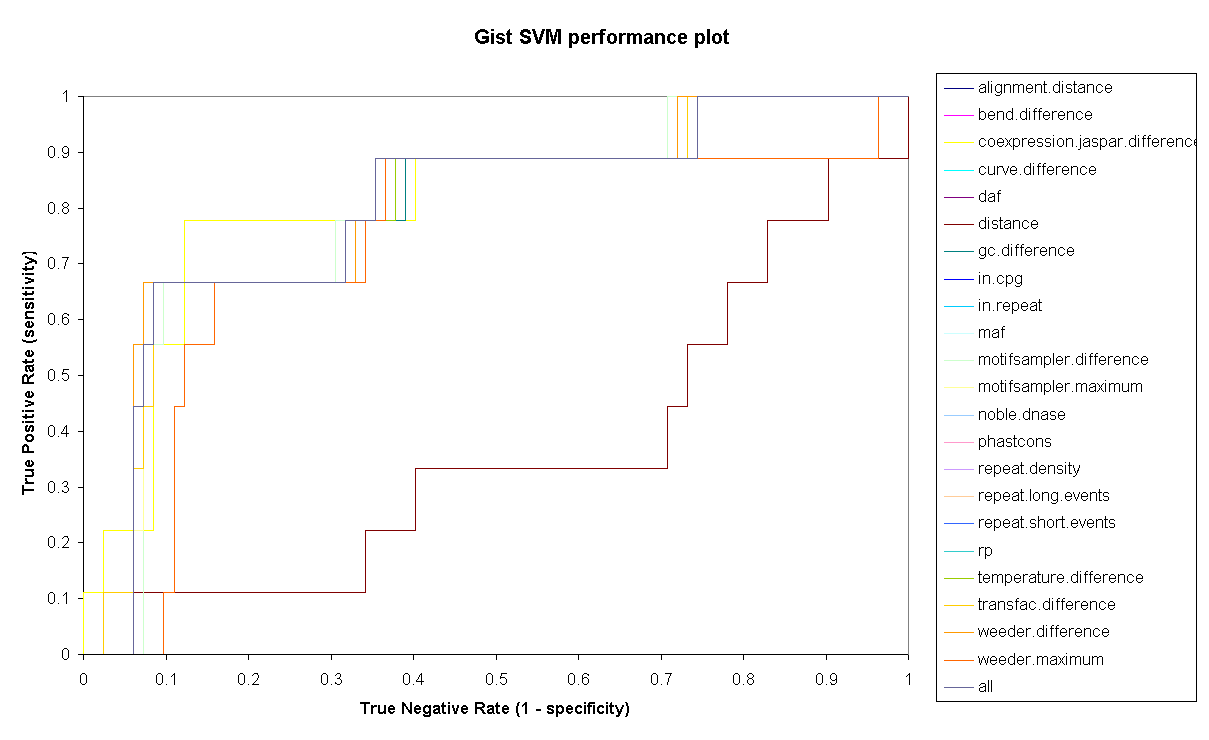
Gist Plots
SVM performance for each tested partition
|
ALL
|
GROUP
|
|
Partition 1
|
|
|
|
Partition 2
|
|
|
|
Partition 3
|
|
|
|
Partition 4
|
|
|
|
Partition 5
|
|
|
|
Partition 6
|
|
|
|
Partition 7
|
|
|
|
Partition 8
|
|
|
|
Partition 9
|
|
|
|
Partition 10
|
|
|
These plots were built in Excel using the VBA code:
Sub BuildChart()
    Charts.Add
    ActiveChart.ChartType = xlXYScatterLinesNoMarkers

    Dim columnLength As Integer
    columnLength = Sheets(Sheets.Count).UsedRange.SpecialCells(xlLastCell).Column

    If columnLength < 1 Or columnLength > 256 Then
        ColNo2ColRef = "#VALUE!"
    End If
    ColNo2ColRef = Sheets(Sheets.Count).Cells(1, columnLength).Address(True, False, xlA1)
    ColNo2ColRef = Left(ColNo2ColRef, InStr(1, ColNo2ColRef, "$") - 1)

    Dim sheetName As String
    sheetName = Sheets(Sheets.Count).Name

    MsgBox sheetName

    ActiveChart.SetSourceData Source:=Sheets(Sheets.Count).Range("E1:" + ColNo2ColRef + "2"), PlotBy:= _
        xlRows

    For i = 1 To 23 Step 1
        x = (i * 2) - 1
        y = x + 1
        If (i <> 1) Then
            ActiveChart.SeriesCollection.NewSeries
        End If
        ActiveChart.SeriesCollection(i).XValues = "=" & sheetName & "!R" & y & "C5:R" & y & "C" & columnLength
        ActiveChart.SeriesCollection(i).Values = "=" & sheetName & "!R" & x & "C5:R" & x & "C" & columnLength
        ActiveChart.SeriesCollection(i).Name = "=" & sheetName & "!R" & x & "C1"
    Next i

    ActiveChart.Location Where:=xlLocationAsNewSheet
    With ActiveChart
        .HasTitle = False
        .Axes(xlCategory, xlPrimary).HasTitle = False
        .Axes(xlValue, xlPrimary).HasTitle = False
    End With
    ActiveChart.HasLegend = True
    ActiveChart.Legend.Select
    Selection.Position = xlRight
    ActiveChart.Axes(xlValue).MaximumScale = 1
    ActiveChart.Axes(xlCategory).MaximumScale = 1
    ActiveChart.PlotArea.Interior.ColorIndex = 2
    ActiveChart.Axes(xlValue).MajorGridlines.Border.ColorIndex = 2
    With ActiveChart
        .HasTitle = True
        .ChartTitle.Text = "Gist SVM performance plot"
        .Axes(xlCategory, xlPrimary).HasTitle = True
        .Axes(xlCategory, xlPrimary).AxisTitle.Characters.Text = _
        "True Negative Rate (1 - specificity)"
        .Axes(xlValue, xlPrimary).HasTitle = True
        .Axes(xlValue, xlPrimary).AxisTitle.Characters.Text = _
        "True Positive Rate (sensitivity)"
    End With
    ActiveChart.Legend.Select
    Selection.Top = 42
    Selection.Height = 380
    ActiveChart.ChartArea.Select
End Sub
|