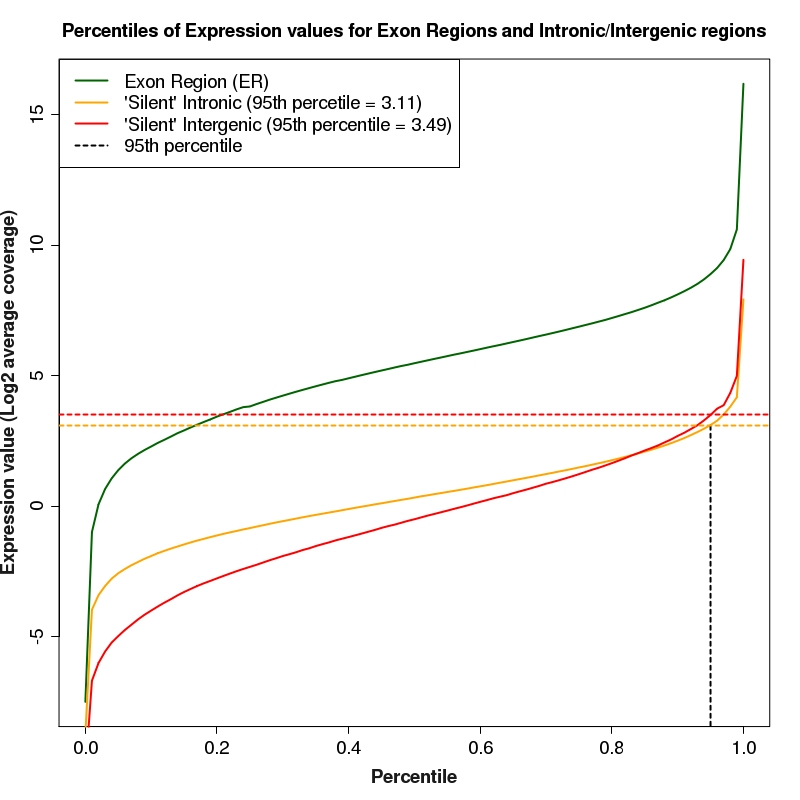
Statistics and figures for sequencing library: HS1122 (PC9_DMSO)
Summary of read assignments by assignment class
| Read Class | Read Count | Percent of Total |
| Total read count | 10,489,294 | 100% |
| Read1-Read2 identical | 1,354 | 0.01% |
| Low complexity | 76,775 | 0.73% |
| Low quality (>1 N) | 375,213 | 3.58% |
| Ensembl transcript | 6,475,961 | 61.74% |
| Ensembl transcript (ambiguous) | 461,751 | 4.40% |
| Novel exon junction | 763 | 0.01% |
| Novel exon junction (ambiguous) | 27 | 0.00% |
| Novel exon boundary extension | 14,900 | 0.14% |
| Novel exon boundary extension (ambiguous) | 953 | 0.01% |
| Intron | 402,673 | 3.84% |
| Intron (ambiguous) | 9,240 | 0.09% |
| Intergenic | 244,688 | 2.33% |
| Intergenic (ambiguous) | 5,720 | 0.05% |
| Repeat element | 206,929 | 1.97% |
| Repeat element (ambiguous) | 55,145 | 0.53% |
| Unassigned | 2,157,200 | 20.57% |
Summary of average coverage values by feature type
| Feature Type | Average Coverage | Total Base Count | Cumulative Coverage |
| Gene | 4.59481 | 70,657,218 | 324,656,740 |
| Transcript | 3.61137 | 46,317,996 | 167,271,404 |
| ExonRegion | 4.59481 | 70,657,218 | 324,656,740 |
| Junction | 0.38311 | 137,098,120 | 52,523,537 |
| KnownJunction | 3.85127 | 13,544,706 | 52,164,265 |
| NovelJunction | 0.00291 | 123,553,414 | 359,272 |
| Boundary | 0.31384 | 26,598,682 | 8,347,693 |
| KnownBoundary | 2.95707 | 1,328,722 | 3,929,124 |
| NovelBoundary | 0.17485 | 25,269,960 | 4,418,569 |
| Intron | 0.01823 | 1,089,861,286 | 19,863,675 |
| ActiveIntronRegion | 0.10415 | 79,490,299 | 8,279,262 |
| SilentIntronRegion | 0.01146 | 1,009,728,466 | 11,573,506 |
| Intergenic | 0.00649 | 1,852,676,967 | 12,030,349 |
| ActiveIntergenicRegion | 0.18558 | 43,133,494 | 8,004,800 |
| SilentIntergenicRegion | 0.00222 | 1,809,415,481 | 4,018,260 |
Summary of expressed events by feature type
| Feature Type | Feature Count | Expressed (%) | Not Expressed (%) |
| Gene | 36,954 | 10,009 (27.09%) | 26,945 (72.91%) |
| Transcript | 62,372 | 7,058 (11.32%) | 55,314 (88.68%) |
| ExonRegion | 277,805 | 113,851 (40.98%) | 163,954 (59.02%) |
| Junction | 2,211,261 | 89,386 (4.04%) | 2,121,875 (95.96%) |
| KnownJunction | 218,464 | 88,372 (40.45%) | 130,092 (59.55%) |
| NovelJunction | 1,992,798 | 1,014 (0.05%) | 1,991,784 (99.95%) |
| Boundary | 429,012 | 12,146 (2.83%) | 416,866 (97.17%) |
| KnownBoundary | 21,432 | 5,867 (27.37%) | 15,565 (72.63%) |
| NovelBoundary | 407,581 | 6,279 (1.54%) | 401,302 (98.46%) |
| Intron | 204,178 | 392 (0.19%) | 203,786 (99.81%) |
| ActiveIntronRegion | 250,770 | 2,038 (0.81%) | 248,732 (99.19%) |
| SilentIntronRegion | 312,398 | 554 (0.18%) | 311,844 (99.82%) |
| Intergenic | 28,382 | 135 (0.48%) | 28,247 (99.52%) |
| ActiveIntergenic | 123,007 | 2,348 (1.91%) | 120,659 (98.09%) |
| SilentIntergenic | 110,401 | 571 (0.52%) | 109,830 (99.48%) |
| GRAND TOTAL (non-redundant) | 4,046,540 | 238,488 (5.89%) | 3,808,052 (94.11%) |
Estimates of intronic and intergenic noise levels (95th percentiles of silent intron and intergenic regions)
95th percentile of silent intron regions for library (HS1122) is: 8.61 (log2 = 3.11)
95th percentile of silent intergenic regions for library (HS1122) is: 11.24 (log2 = 3.49)
Estimates of signal-to-noise ratio
(Average coverage of exon regions / Average coverage of silent intron regions) = 400.94
(Average coverage of exon regions / Average coverage of silent intergenic regions) = 2069.73
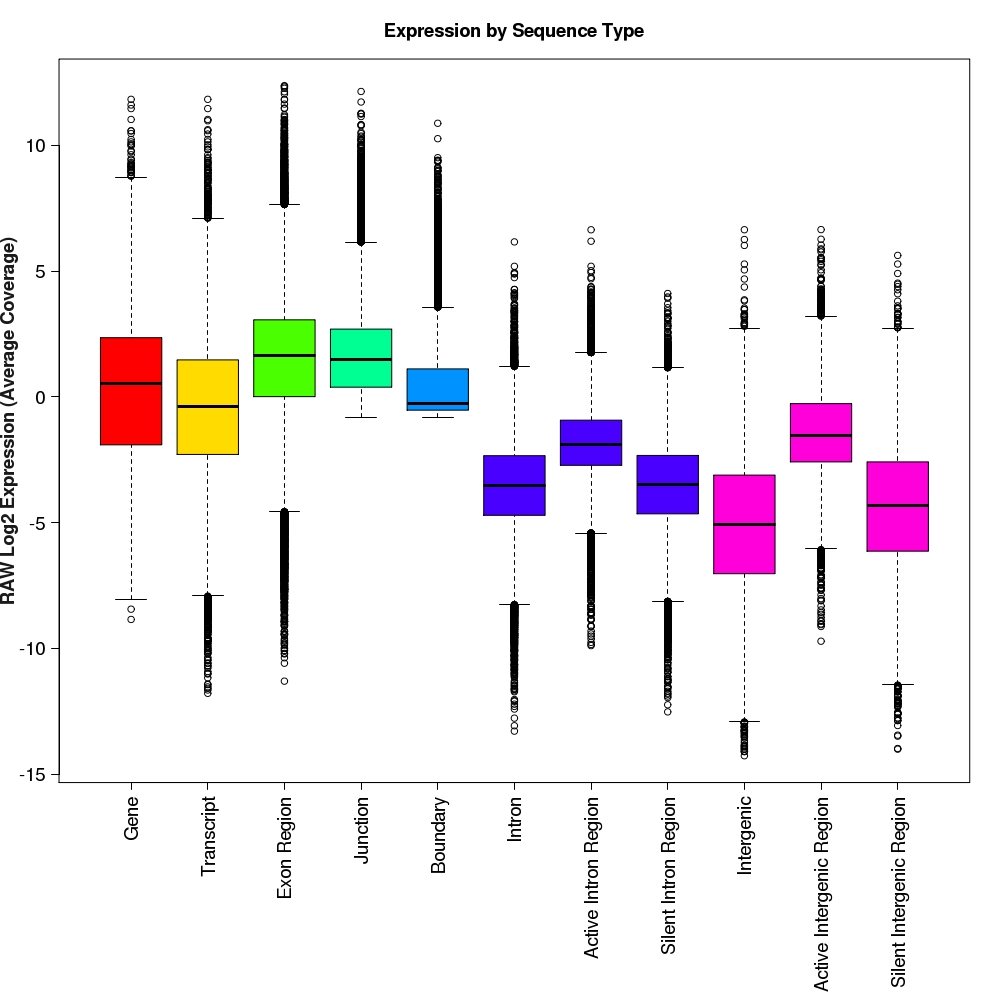
Distribution of log2 raw expression values for each feature type
Box-and-whisker plots for log2 expression values for each feature type.
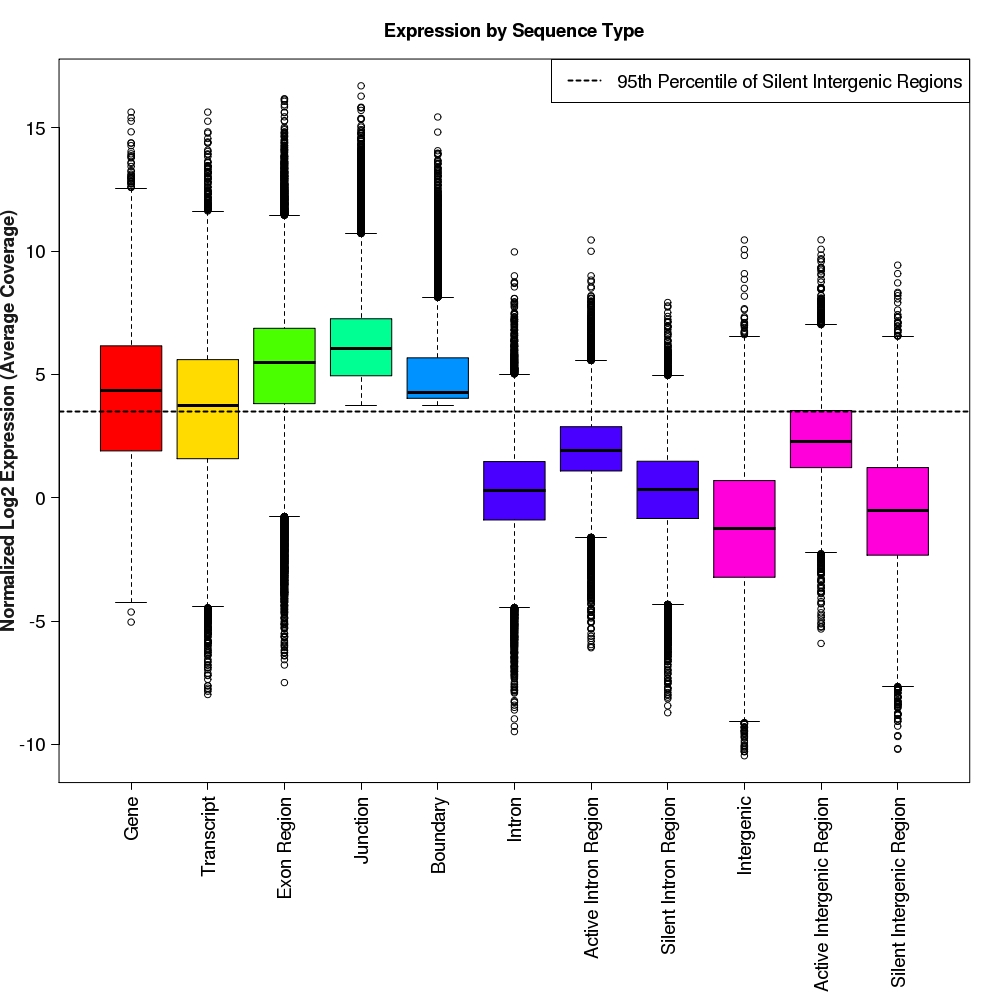
Distribution of log2 normalized expression values for each feature type
Box-and-whisker plots for normalized log2 expression values for each feature type.
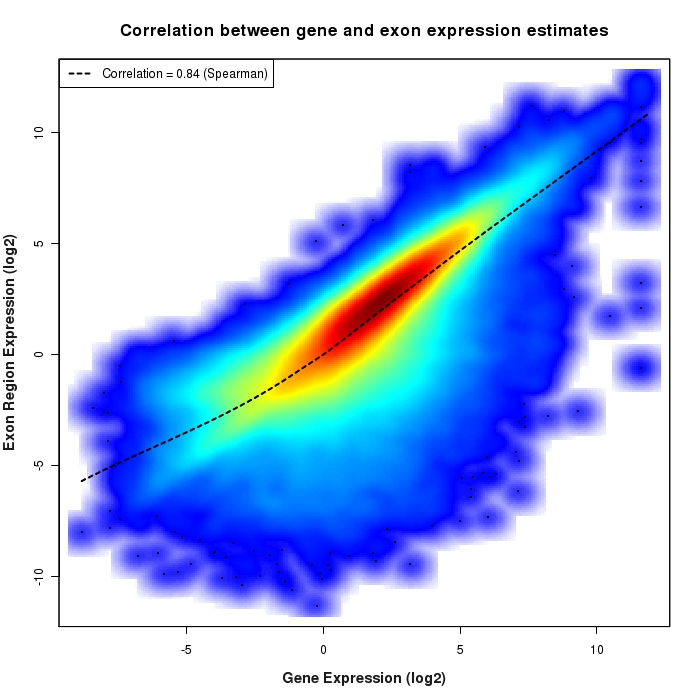
Density scatter plot of exon region versus gene expression values
Density scatter plot of log2 expression values for exon regions versus corresponding gene expression values.
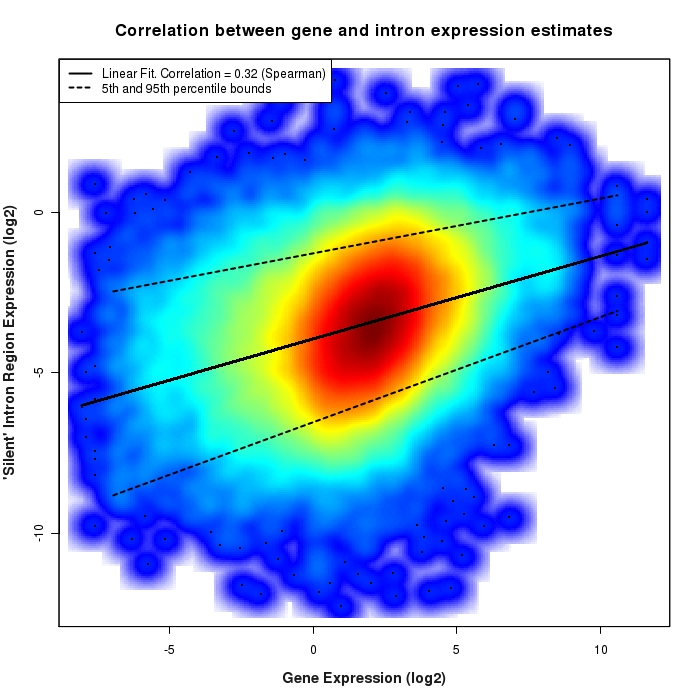
Density scatter plot of silent intron region versus gene expression values
Density scatter plot of log2 expression values for silent intron regions versus corresponding gene expression values.
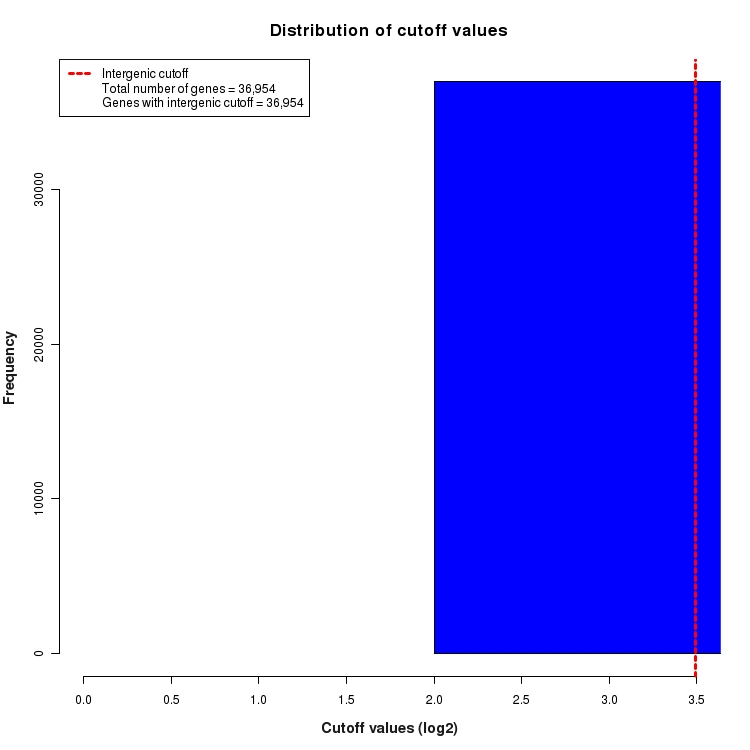
Distribution of gene-by-gene expression cutoff values
Histogram depicting the distribution of expression cutoff values used for each gene. In order to be considered 'expressed above background', all features (genes, transcripts, exons, junctions, etc.) must be expressed above the level of INTERGENIC noise. This INTERGENIC cutoff is the 95th percentile of expression values for all Silent Intergenic Regions in this library and is depicted below as a dotted red line. The number of genes for which only INTERGENIC noise is considered is provided in the legend. For features within the boundaries of highly expressed genes, additional noise is expected due to the presence of un-processed RNA contamination. For this reason, a higher INTRAGENIC cutoff is determined. These are calculated by fitting a linear model to the 95th percentile of expression values for silent intronic regions. The INTRAGENIC cutoff for a gene is then determined by using the gene expression level and the coefficients of the model fit. The distribution of the resulting gene-by-gene cutoffs is depicted below as a histogram. The number of genes that required an INTRAGENIC cutoff is also indicated in the legend.
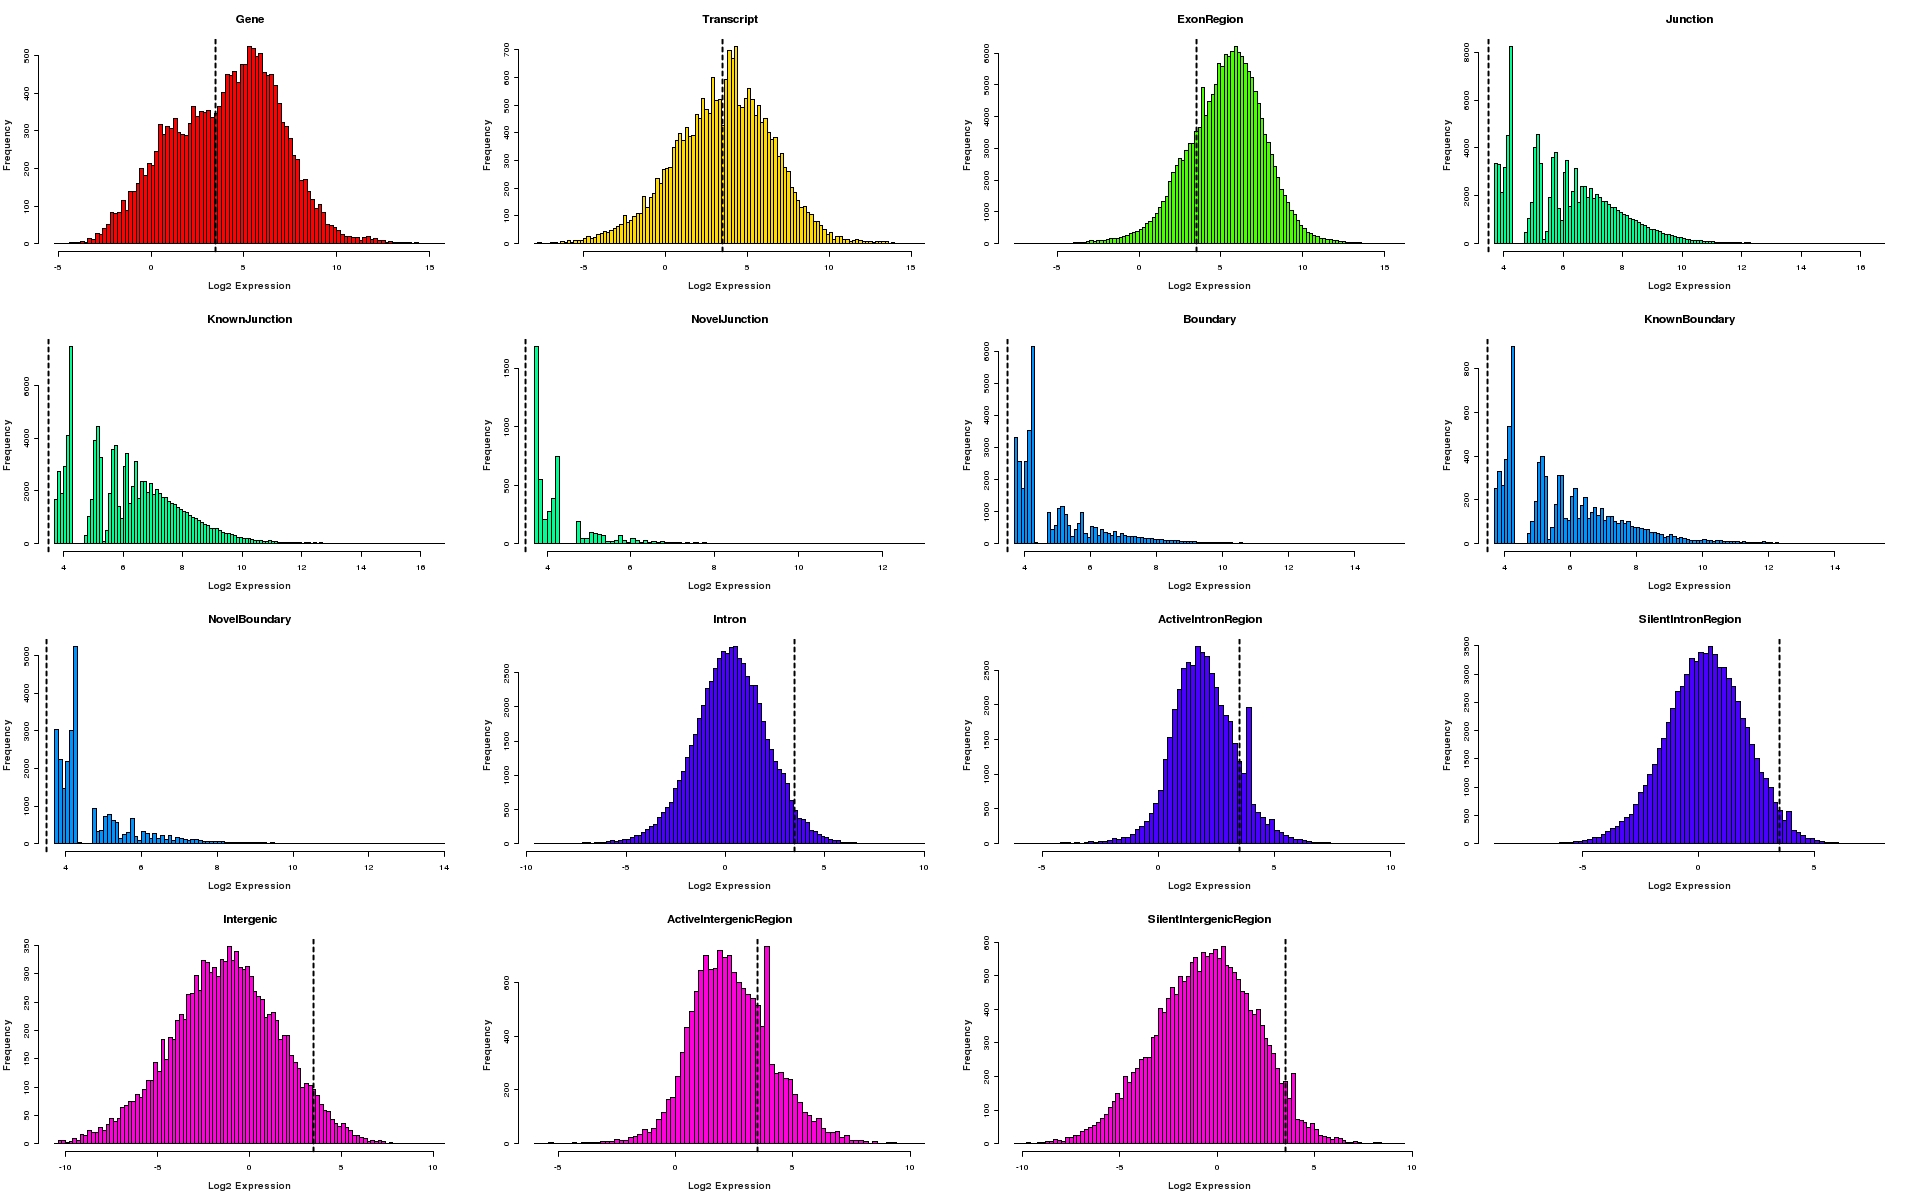
Histograms of expression values for each feature type
Histograms depicting distribution of log2 expression values for individual feature types. The 95th percentile of expression values for silent intergenic region is depicted as a dotted line on all plots.
Percentiles plot for expression of exon regions, silent intron regions and silent intergenic regions
Percentiles plot for exon region, silent intron region and silent intergenic region expression values. The 95th percentiles of intronic and intergenic distributions are depicted as colored, dotted lines
