Distributions and lists of all significant differential expression values of the type: Intergenic for comparisons: A431_IRTR_vs_DMSO, PC9_IRTR_vs_DMSO (p-value < 0.05 after multiple testing correction and Fold-Change > 1.5)
Distribution of log2 differential expression values for comparison: A431_IRTR_vs_DMSO and data type: Intergenic
Distribution of all differential expression values that meet the p-value and fold-change cutoff for the feature type: Intergenic. The total number of significant DE features, as well as the max and min log2 DE observed are noted in the legend. *If you can not see the figure below, click here
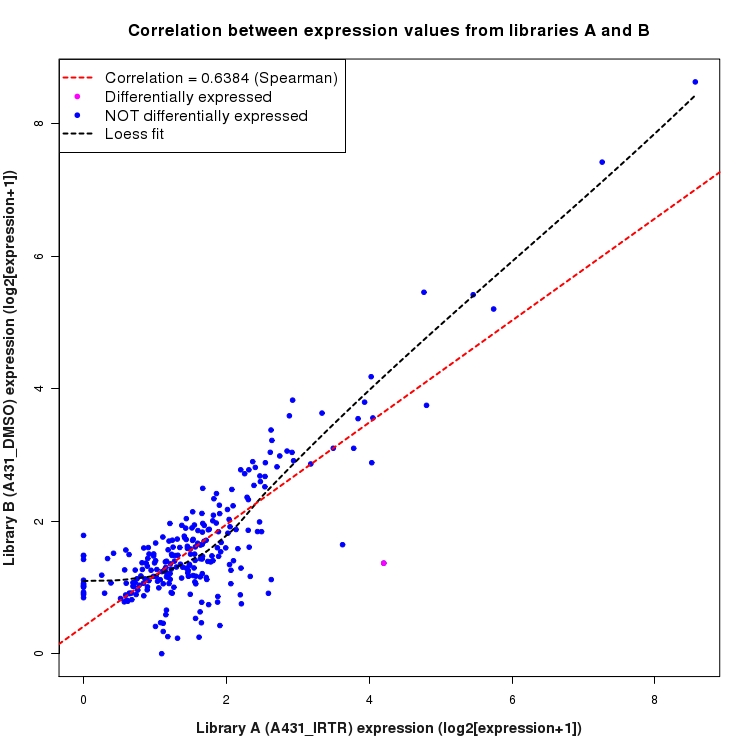
Scatter plot of log2 expression values for comparison: A431_IRTR_vs_DMSO and data type: Intergenic
Correlation between expression values for all features that are expressed above background in one or both libraries for the feature type: Intergenic. Features that are differentially expressed (meet the p-value and fold-change cutoff) are indicated in magenta. A linear model is fit to the data and the correlation by Spearman method is reported. A loess model is also fit to illustrate the trend of the data.

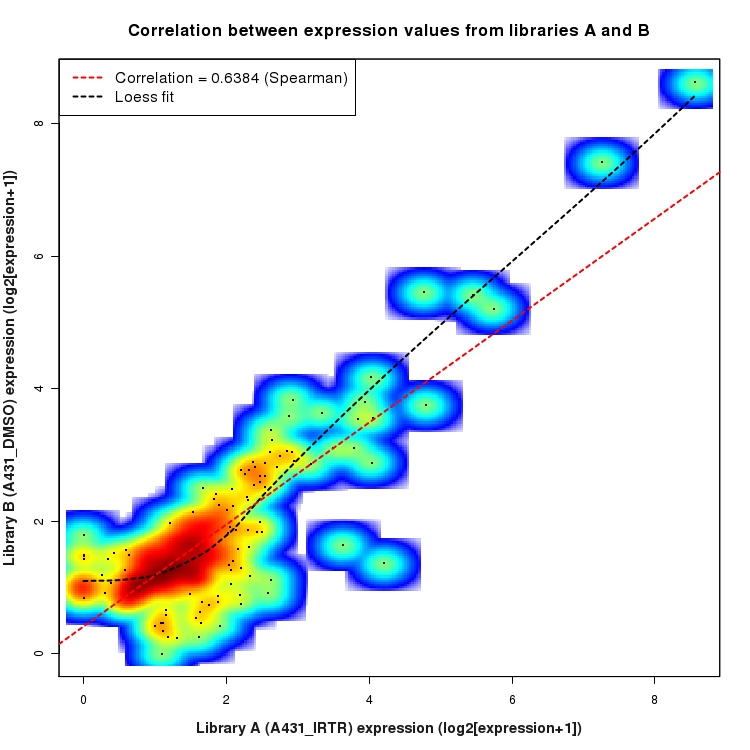
SmoothScatter plot of log2 expression values for comparison: A431_IRTR_vs_DMSO and data type: Intergenic
Correlation between expression values for all features that are expressed above background in one or both libraries for the feature type: Intergenic. A linear model is fit to the data and the correlation by Spearman method is reported. A loess model is also fit to illustrate the trend of the data.

Distribution of log2 differential expression values for comparison: PC9_IRTR_vs_DMSO and data type: Intergenic
Distribution of all differential expression values that meet the p-value and fold-change cutoff for the feature type: Intergenic. The total number of significant DE features, as well as the max and min log2 DE observed are noted in the legend. *If you can not see the figure below, click here
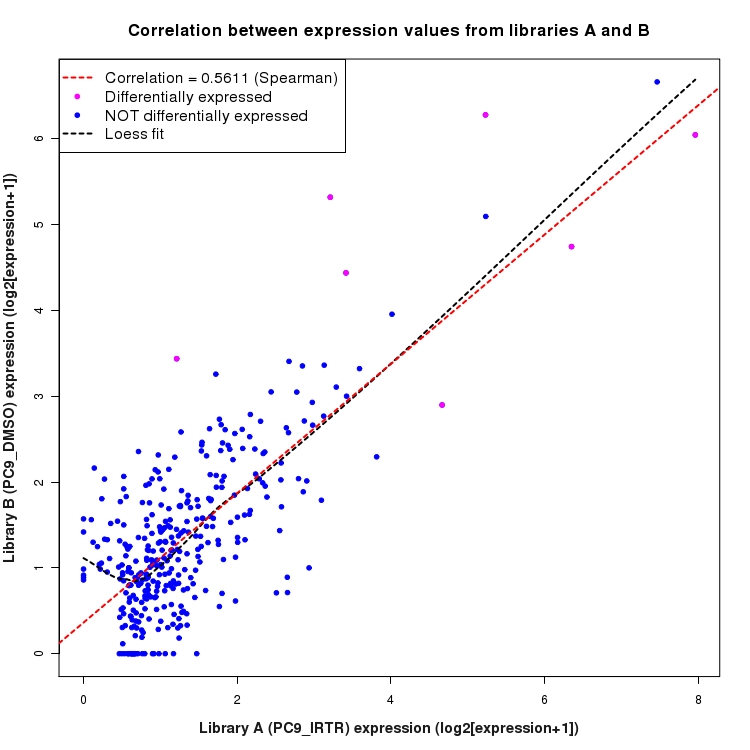
Scatter plot of log2 expression values for comparison: PC9_IRTR_vs_DMSO and data type: Intergenic
Correlation between expression values for all features that are expressed above background in one or both libraries for the feature type: Intergenic. Features that are differentially expressed (meet the p-value and fold-change cutoff) are indicated in magenta. A linear model is fit to the data and the correlation by Spearman method is reported. A loess model is also fit to illustrate the trend of the data.

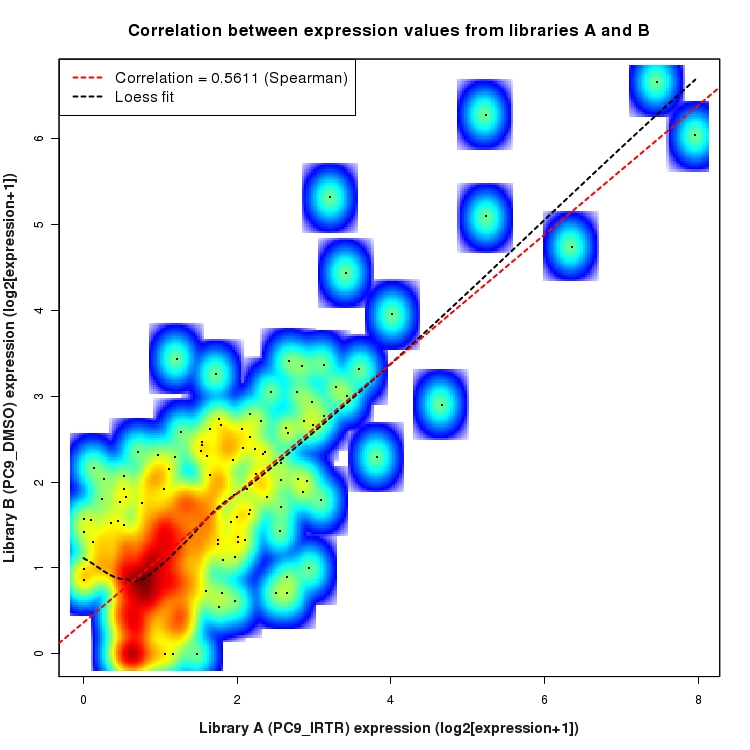
SmoothScatter plot of log2 expression values for comparison: PC9_IRTR_vs_DMSO and data type: Intergenic
Correlation between expression values for all features that are expressed above background in one or both libraries for the feature type: Intergenic. A linear model is fit to the data and the correlation by Spearman method is reported. A loess model is also fit to illustrate the trend of the data.

Significant differentially expressed Intergenic features
The following table provides a ranked list of all significant differentially expressed Intergenic features. Each column corresponds to a pair-wise comparison of two libraries. Each table cell contains the Gene Name (which links to the ALEXA-Seq gene record), the Feature Name, the name of each library being compared (which links to the feature's coordinates in the UCSC Genome Browser and displays expression data), the fold-change (FC) of the differential expression event, and the multiple testing corrected p-value for the feature. A bold row indicates that the feature is not currently supported by EST or mRNA sequence alignments. For exon junction features the number of exons skipped by the junction is indicated as 'Sn' where n is the number of exons skipped (e.g. S0 means no exons skipped, S1 means one exon skipped, etc.).
| RANK | A431_IRTR_vs_DMSO (Gene | Feature | Links | Values) | PC9_IRTR_vs_DMSO (Gene | Feature | Links | Values) |
| 1 | TRIM31 | IG51 | (A431_IRTR) | (A431_DMSO) | FC = 7.14 | q.value = 0.0026 | RLBP1L1 ASPH | IG21 | (PC9_IRTR) | (PC9_DMSO) | FC = -4.68 | q.value = 0.00188 |
| 2 | EMPTY | SSU_rRNA_5 | IG4 | PC9_IRTR | PC9_DMSO | FC = -4.31 | q.value = 1.18e-10 |
| 3 | EMPTY | SSU_rRNA_5 | IG1 | (PC9_IRTR) | (PC9_DMSO) | FC = 3.77 | q.value = 1.05e-27 |
| 4 | EMPTY | RAB14 | IG51 | (PC9_IRTR) | (PC9_DMSO) | FC = 3.40 | q.value = 0.0392 |
| 5 | EMPTY | NACA | IG51 | (PC9_IRTR) | (PC9_DMSO) | FC = 3.04 | q.value = 1.2e-05 |
| 6 | EMPTY | AC114498.2 AC114498.2 | IG22 | (PC9_IRTR) | (PC9_DMSO) | FC = -2.07 | q.value = 1.58e-08 |
| 7 | EMPTY | FAM38A AC138028.1 | IG6 | (PC9_IRTR) | (PC9_DMSO) | FC = -2.03 | q.value = 0.0382 |